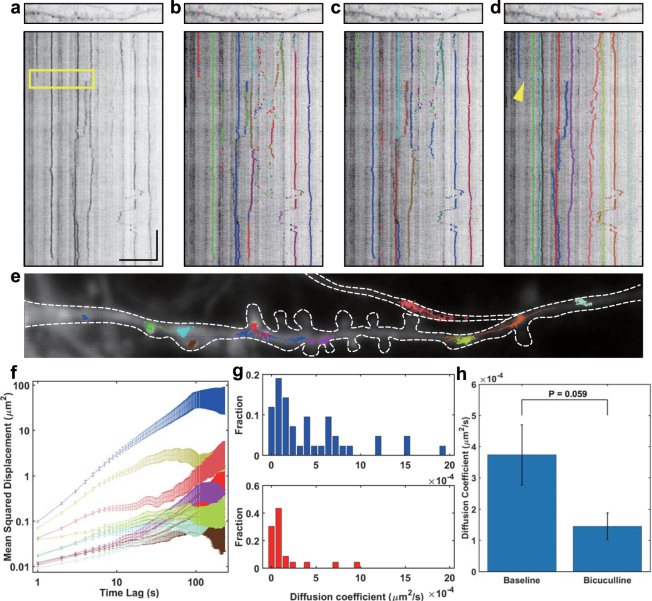
Figure 2.
Application of HybTrack to track mRNAs in neurons. (a) Image of mRNAs in a dendrite and kymograph (x-t) generated from the time-lapse image. Scale bar, 10 µm (horizontal) and 1 min (vertical). (b–d) Tracking results from u-Track (b), TrackNTrace (c) and HybTrack (d). Particle trajectories obtained from each program are overlaid on the image (upper panels) and the kymograph (lower panels). Each trajectory is shown in a different color. (e) mRNA trajectories detected by HybTrack are plotted on the time-averaged image. White dashed lines outline the dendrite. (f) The mean squared displacement of 10 mRNAs detected by HybTrack. The error bars are calculated as described in the Methods section. (g) Histograms of diffusion coefficient of diffusive mRNAs in the baseline (upper panel) and after bicuculline treatment (lower panel). (h) Effect of bicuculline treatment on the mean diffusion coefficient of diffusive mRNAs in the dendrites. Error bars represent SEM (n = 5 dendrites; P = 0.059, pairwise t-test).

