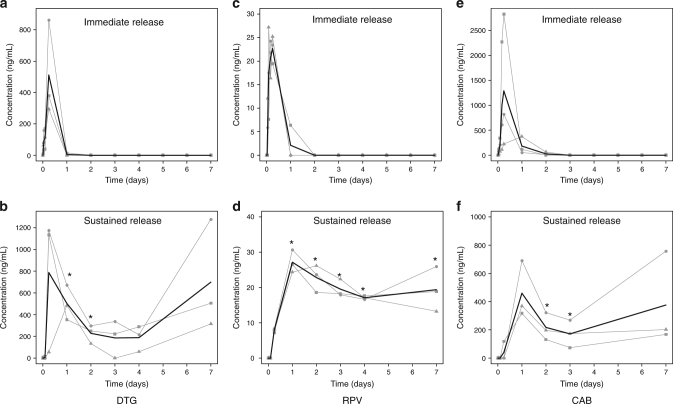
Fig. 4.
Plasma pharmacokinetics of immediate release and sustained release antiretrovirals. The concentration time profiles of (a) DTG immediate release (b), DTG sustained release (c), RPV immediate release (d), RPV sustained release (e), CAB immediate release and (f) CAB sustained release are shown. Each dosage form was tested in three animals, and plasma samples from each animal were processed three times. Data was first averaged within each animal (shown by the grey lines) and then between animals in each treatment group (shown by the black line). *indicates p < 0.05, two sample t test comparing sustained release formulations and immediate release formulations at matching time points

