
Figure 1.
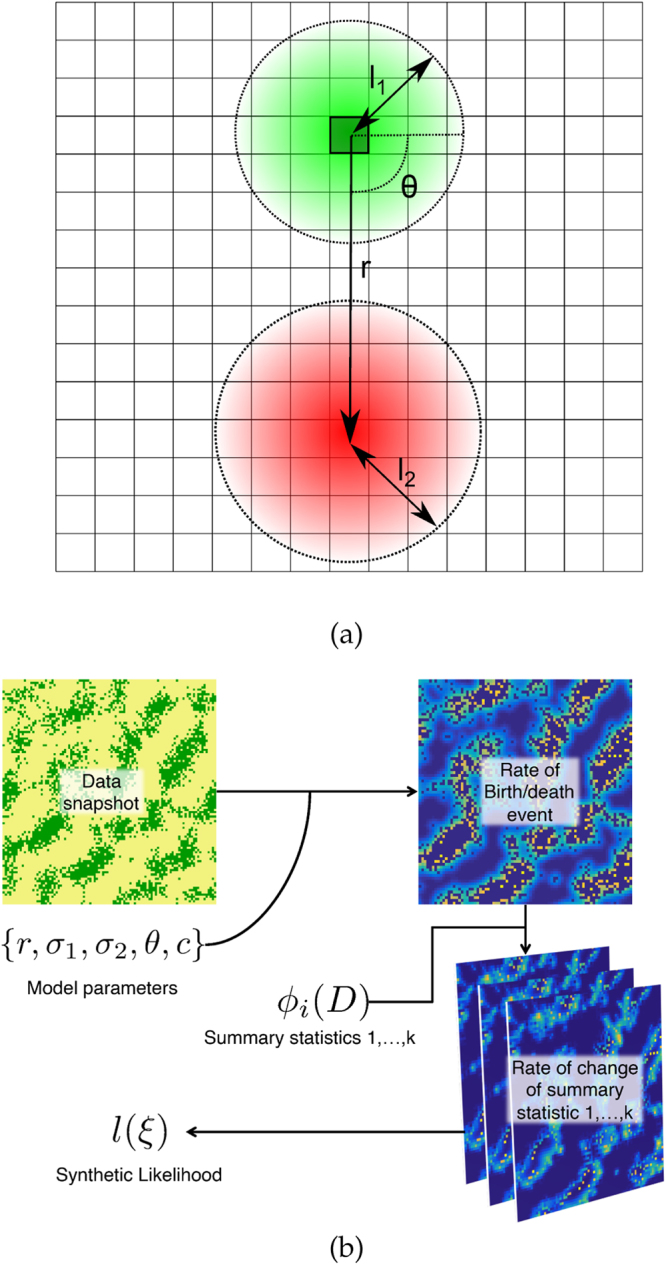
(a) Schematic of PCA model. An occupied site is shown as a dark square with border, with its kernel of reproduction surrounding it with length-scale . The competition kernel is at angle θ and displacement r, with its own characteristic length-scale . (b) Overview of likelihood generation. Procedure begins with a set of model parameters and the underlying data (top-left). Using the model-based rates, the rate of a birth/death event can be calculated for each lattice site (top-right). A choice of summary statistics can then be applied to these rates to produce a set of rates of changes of summary statistic for each lattice site, which is then summed over the whole lattice (bottom-right). These are then aggregated together to produce a single value, which represents the synthetic likelihood l(ξ).