
FIG 5 .
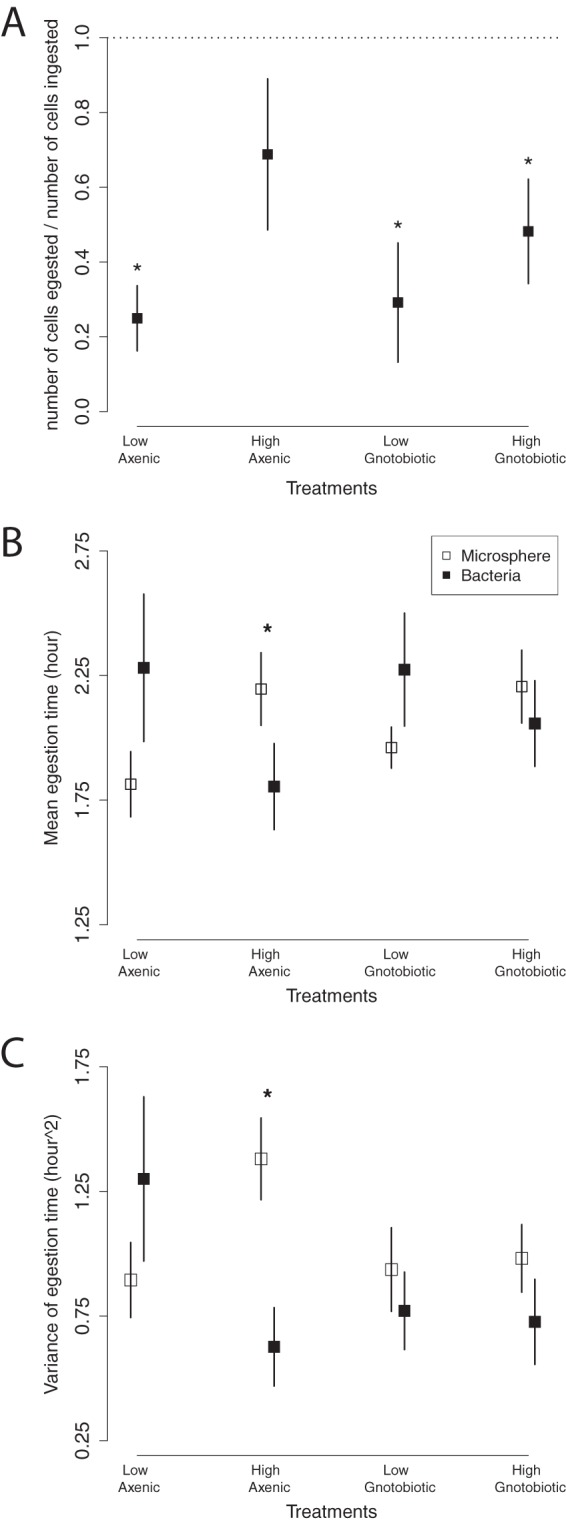
(A) Mean ± SEM of proportion of ingested bacteria that is egested (i.e., the number of bacterial cells egested divided by the number of bacterial cells ingested) in the four different treatments. The dotted line (proportion egested = 1) corresponds to the number of ingested microbial cells predicted from the number of microspheres in the feces. An asterisk indicates that the proportion of ingested bacteria that is egested is significantly <1 (P < 0.05). The sample mean ± SEM of mean egestion time (B) and variance of the egestion time (C) of microspheres (□) and bacteria (■) are shown. Statistics were calculated by using the proportional particles egested at each hour (out of the total egested over the initial 5 h; Fig. 3A and B) as the probability distribution of egestion times. See the text for further details. An asterisk indicates significantly different statistics between microspheres and bacteria (P < 0.05).