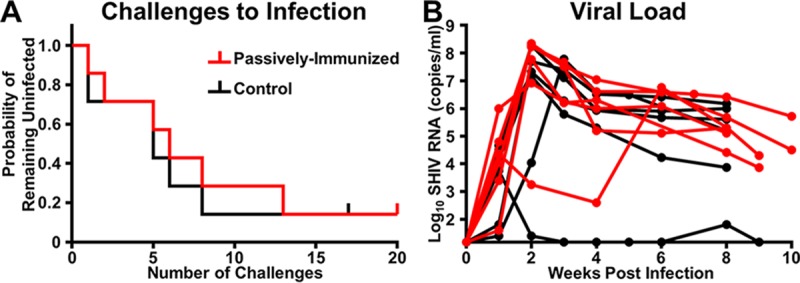
FIG 7 .

The distributions of the number of challenges to infection and median peak VL and set point were similar between treatment groups. The probability of remaining uninfected (A) was similar between passively immunized infants (red line) and control infants (black line) orally challenged with SHIV1157ipd3N4 (P = 0.72, exact log-rank test). The median peak VL (B) and set point at 8 weeks postinfection of infants in both groups were similar (P = 0.51 and 1.0, respectively; exact Wilcoxon rank sum test). The vertical notches in panel A represent the two uninfected monkeys. The lines in panel B represent individual infants that became infected.
