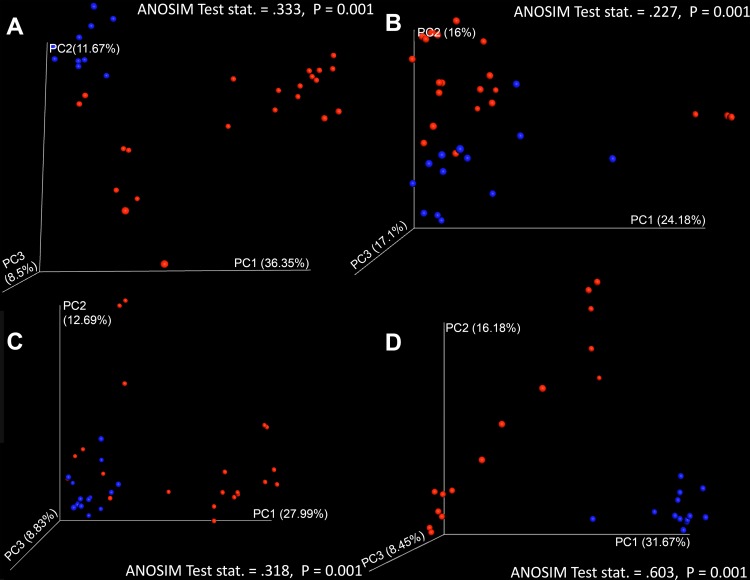
FIG 4 .
Three-dimensional principal-coordinate (PC) analysis plots were generated in QIIME 1.9.0 and visualized with EMPeror to Bray-Curtis distances between CDI and non-CDI samples in each treatment cohort (A, untreated; B, fidaxomicin; C, metronidazole; D, vancomycin) considering fungal taxon annotations. Here, we can visualize significant differential clustering between disease statuses when all treatment cohorts are included (ANOSIM P < 0.002).

