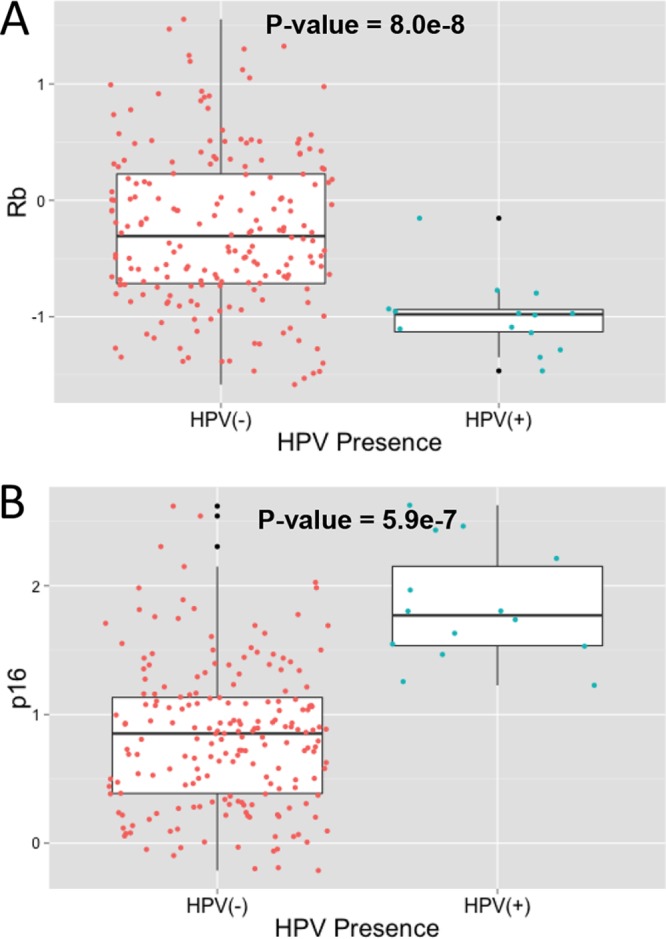
FIG 3 .

Variations in protein expression of Rb and p16 based on HPV presence. Levels of protein expression of Rb (A) and p16 (B) in HNSCC tumor samples were retrieved from TCGA as described in Materials and Methods. Expression levels were compared across tumors (z score) and visualized as boxplots based on the presence of HPV. The difference in protein expression between HPV+ and HPV− samples was compared using a t test. Data for HPV− samples are in red, data for HPV+ samples are in blue, and data for outliers are in black.
