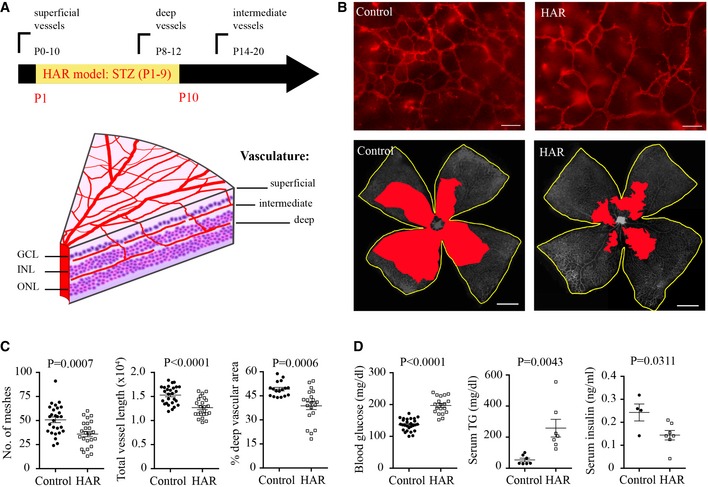
Figure 2. A novel mouse model of hyperglycemia‐associated retinopathy (HAR) was established and compared with normoglycemic controls in P10 neonates.

- The mouse neonates received intraperitoneal injection of STZ and schematic graph shows mouse retinal vessel development after birth (left). GCL, ganglion cell layer; INL, inner nuclear layer; ONL, outer nuclear layer.
- Representative images of the deep vascular network in isolectin‐stained (red, top) retinal whole mounts of HAR and controls. Scale bar, 50 μm (top) and 1 mm (bottom). The total retinal area is outlined in yellow and deep vascular coverage is highlighted in red (bottom, grayscale).
- Quantification of deep vascular network of HAR and controls. n = 17–27 retinas/group. Data presented as mean ± SEM, unpaired t‐test.
- Blood glucose (n = 19–27 retinas/group), serum insulin (ELISA) (n = 4–7 pooled samples/group) and triglyceride (TG) concentrations (n = 7/group) of HAR and controls. Data presented as mean ± SEM, unpaired t‐test.
