-
A
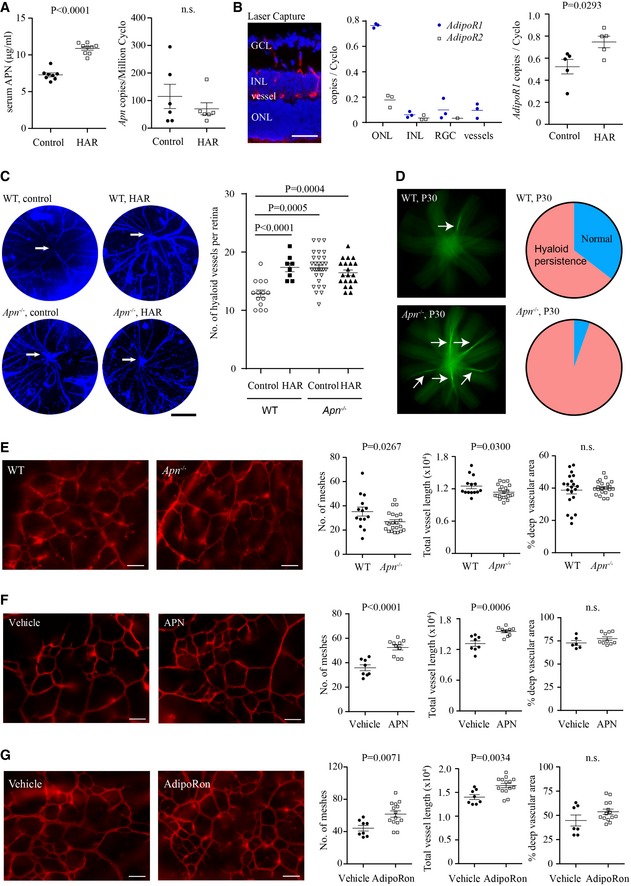
Left: serum APN levels (ELISA) (n = 8–9 retinas/group); right: retinal apn (qRT–PCR) (n = 6 retinas/group) of HAR and controls.
-
B
Left: retinal cross‐sectional layers for laser capture microdissection (LCM: DAPI for nuclei, blue; isolectin for vessels, red); center: mRNA levels of AdipoR1 and AdipoR2 in retinal neuronal layers and vessels. n = 3 pooled retinas/group. Right: AdipoR1 mRNA in HAR and control retinas. n = 5 retinas/group.
-
C
Control and HAR eyes in WT and Apn
−/− mice. Left: representative images of DAPI‐stained hyaloid vessels (blue). Right: quantification of preserved hyaloid vessels branching from the hyaloid artery (white arrow). Scale bar, 1 mm. n = 8–30 retinas/group.
-
D
Left: Fundus photograph focused to show persistent hyaloid vessels (white arrows) (green, fluorescein AK‐FLUOR) in WT and Apn
−/− mice at P30 (n = 37–48 retinas/group); right: pie graph of percentage of eyes examined with persisting hyaloid.
-
E
Left: In WT and Apn
−/− representative images of deep retinal vasculature (lectin, red) in whole‐mounted retinas; right: quantification of deep vessels (n = 14–22 retinas/group).
-
F, G
Left: Representative images of deep retinal vasculature (lectin, red) in whole‐mounted retinas of WT hyperglycemic (HAR) mice with recombinant mouse APN treatment (F) (n = 6–10 retinas/group) or with AdipoRon treatment (G). Right: quantification of deep retinal vasculature (n = 7–14 retinas/group).
Data information: Scale bars, 50 μm (B, E–G) or 1 mm (C). Data presented as mean ± SEM; unpaired
t‐test (A, B, E–G) or ANOVA (C). See also Fig
EV2.

