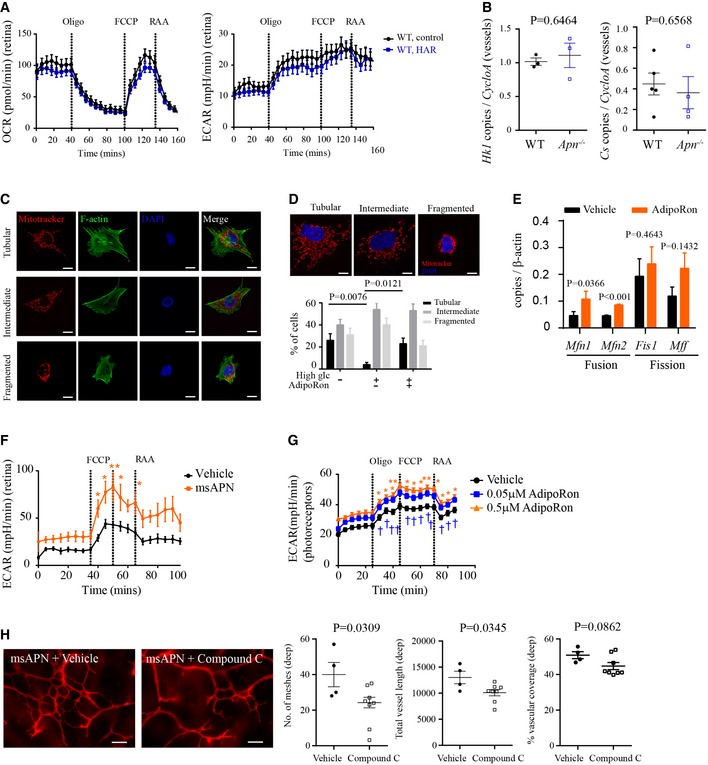
Oxygen consumption rate (OCR) and extracellular acidification rate (ECAR) of WT control and HAR P10 retinas. n = 5–6 animals (24–32 punches) per group.
APN deficiency did not affect retinal metabolic enzyme mRNA in deep retinal blood vessels. qRT–PCR of Hk1 and Cs in LCM deep blood vessels in Apn
−/− versus WT HAR mice. n = 3 pooled retinas/group. Unpaired t‐test.
Mitochondrial and cytoskeleton morphology in 661W cells. Cell was stained with MitoTracker for mitochondria (red), F‐actin for cytoskeleton (green), and DAPI for nucleus (blue). Images were taken under 630× magnification. Scale bar, 10 μm.
Mitochondrial morphology (MitoTracker, red) under hyperglycemic condition, in the presence of AdipoRon or vehicle. Images were taken under 630× magnification. Scale bar, 10 μm. The number of cells within each category of mitochondrial morphology (tubular, intermediate, and fragmented) was counted and represented as a percentage of the total number of cells. n = 30 images/group. Kruskal–Wallis test.
qRT–PCR of mitochondrial fusion (Mfn1, Mfn2) and fission (Fis1, Mff) proteins in AdipoRon‐ versus vehicle‐treated 661W cells. n = 7–9/group. Unpaired t‐test (Mfn1, Mfn2, Mff); Mann–Whitney test (Fis1).
Extracellular acidification rate (ECAR) of WT retinas treated with msAPN or vehicle (PBS). n = 6 animals (12 punches) per group. ANOVA, *P < 0.05, **P < 0.01.
ECAR of 661W cells treated with AdipoRon or vehicle. n = 10 per group. ANOVA, *P < 0.05, **P < 0.01 (0.5 μM AdipoRon versus vehicle); †
P < 0.05, ††
P < 0.01 (0.05 μM AdipoRon versus vehicle).
Deep retinal vascular formation in WT HAR mice co‐treated with msAPN (0.6 μg g−1) and Compound C (AMPK inhibitor, 2 μg g−1) or vehicle from P7 to P9. n = 4–8 per group. Scale bar: 50 μm. Unpaired t‐test.
Data information: Data presented as mean ± SEM (A, B, D–H).

