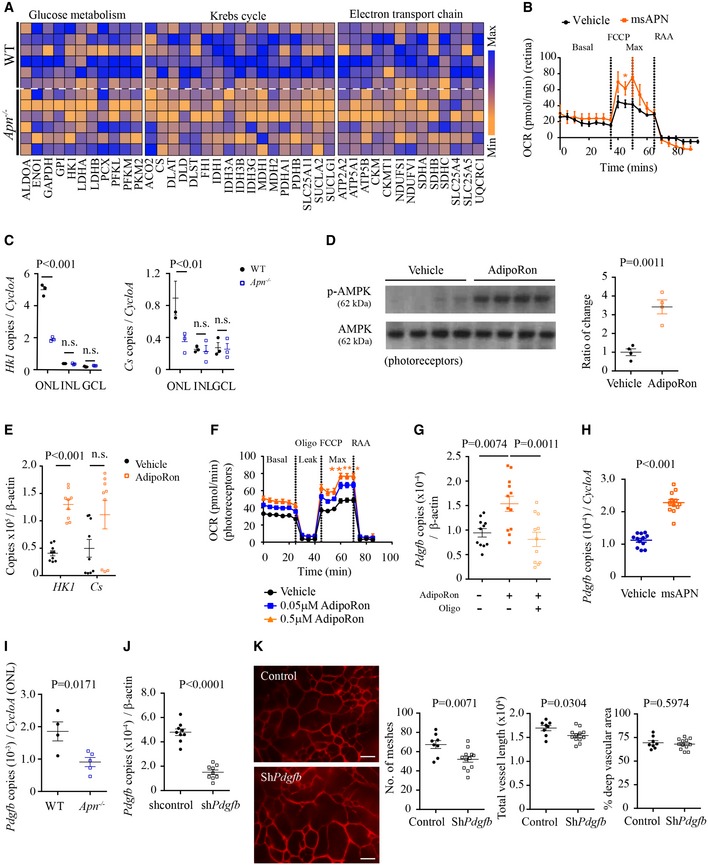
Quantitative proteomic analysis of key glucose metabolic enzymes and mitochondrial metabolic enzymes in hyperglycemic (HAR) WT and Apn
−/− mice at P10. n = 6 mice/group. Blue: maximum of levels; orange: minimum of levels.
Seahorse XFe96 Flux Analyzer oxygen consumption rate (OCR) of WT HAR P10 retinas treated with msAPN or vehicle (PBS). Basal: initial OCR without treatment; max, maximal OCR: after addition of FCCP (carbonyl cyanide‐4‐trifluoromethoxy phenylhydrazone). Treatment with rotenone and antimycin A (RAA) reveals non‐mitochondrial respiration. ANOVA, *P < 0.05. n = 7–8 per group.
mRNA expression of metabolic enzyme (Hk1, Cs) in retinal neuronal layers (ONL, INL, GCL) of Apn
−/− versus WT HAR P10 retinas (LCM and qRT–PCR). n = 3 pooled retinas/group. ANOVA. n.s., not significant.
Western blot for p‐AMPK/AMPK in 661W cells treated with AdipoRon or vehicle. n = 4 per group. Unpaired t‐test.
qRT–PCR of key metabolic enzymes (Hk1, Cs) in AdipoRon‐ versus vehicle‐treated 661W cells. n = 9 per group. Unpaired t‐test. n.s., not significant.
OCR of 661W cells treated with AdipoRon or vehicle. Leak indicates OCR independent of ATP production with proton leak induced with oligomycin (oligo) treatment. n = 10 per group. ANOVA. *P < 0.05, **P < 0.01.
qRT–PCR of Pdgfb in AdipoRon‐ or vehicle‐treated 661W cells with and without oligomycin. n = 12 replicates/group. ANOVA.
qRT–PCR of Pdgfb in msAPN‐ or vehicle‐treated WT HAR retinas. n = 12 replicates/group. Unpaired t‐test.
Pdgfb expression in photoreceptors (ONL from LCM) from Apn
−/− versus WT HAR P10 mice (LCM and qRT–PCR). n = 4–5 replicates from three pooled retinas/group. Unpaired t‐test.
qRT–PCR of Pdgfb in hRK‐shPdgfb‐transfected 661W cells. n = 9 per group. Unpaired t‐test.
Representative images of deep retinal vascular network and quantification in AAV2‐hRK‐Pdgfb‐GFP versus AAV2‐hRK‐GFP (control) virus subretinally injected in WT mice. Retinas were examined at P10. Scale bar, 50 μm. n = 8–12 retinas/group. Unpaired t‐test.
Data information: Data presented as mean ± SEM. See also Figs
.

