-
A
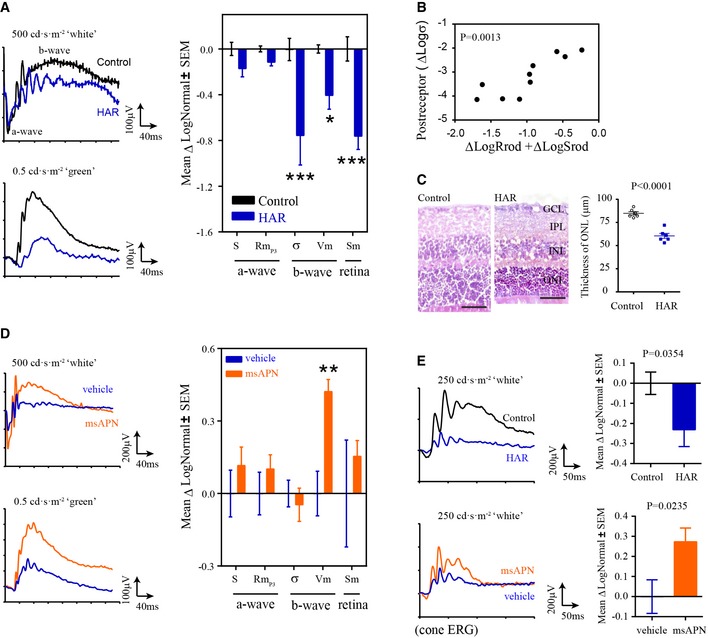
Electroretinogram (ERG) assessment of retinal function in control and HAR mice showing photoreceptor response amplitude (RmP3), sensitivity (S), and post‐receptor response amplitudes (V
m), sensitivity (σ), and retinal sensitivity (S
m). ERG parameters are presented as the log change from control mice. Representative ERG waveforms (left). n = 10–12 per group. *P < 0.05, ***P < 0.001. ANOVA.
-
B
Correlation of post‐receptor sensitivity deficits (Logσ) with the sum of deficits in photoreceptor sensitivity (LogSrod) and saturated amplitude (LogRrod). n = 10–12 per group. Pearson R test.
-
C
Measurement of outer nuclear layer thickness in WT control and HAR retinas at P30. Representative images of H&E‐stained retinal cross sections (left). Scale bar, 50 μm. GCL, ganglion cell layer; IPL, inner plexiform layer; INL, inner nuclear layer; ONL, outer nuclear layer. n = 6 per group. Unpaired t‐test.
-
D, E
Hyperglycemia was induced with 25 mg kg−1 STZ (i.p., daily from P2 to P12) in WT mice. The mouse pups received msAPN (0.6 μg g−1) or vehicle treatment daily from P7 to P39. Littermate controls were used. At P40, rod (D) and cone (E) ERG were conducted. Cone ERG was reflected by post‐receptor responses (V
m). n = 7 to 12 per group. **P < 0.001. ANOVA (D) or t‐test (E).
Data information: Data presented as mean ± SEM (A, C–E).

