
Figure 1. Segregation of ALS and FTD clinical phenotypes by proteomic signatures.
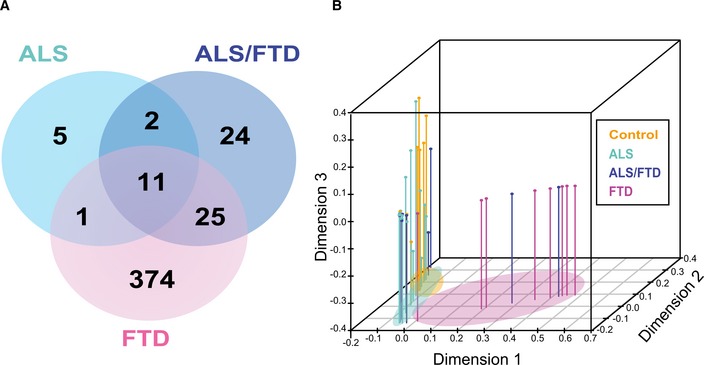
- Venn diagram showing a total of 442 unique proteins determined to be significantly altered by ANOVA followed by Tukey's post hoc test (P ≤ 0.01) among three pairwise comparisons (i) ALS, (ii) ALS/FTD, and (iii) FTD versus control cases.
- Supervised hierarchical clustering of 165 significant proteins altered in the frontal cortex across clinical phenotypes (Control, ALS, ALS‐FTD, and FTD) was used as input for multidimensional scaling (MDS) analysis. Each dimension on the plot explains a larger proportion of variance of the dataset. Clinical groups are indicated by colors (orange—control, light blue—ALS, dark blue—FTD/ALS, and pink—FTD). Segregation of cases based on clinical grouping is indicated by colored ovals.