
Figure EV4. Validation of astrocyte and microglial proteomic markers that increase across the ALS‐FTD spectrum.
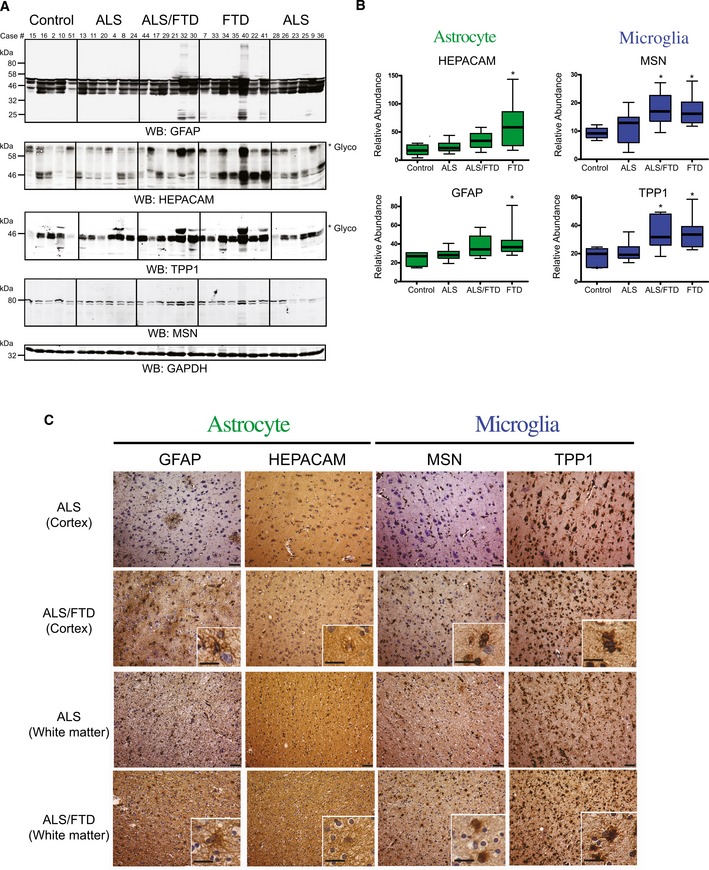
- Western blot analysis for the astrocytic, HEPACAM and GFAP, and microglia, MSN and TTP1, hub proteins (M6) across randomly selected cases from control (n = 5), ALS (n = 12), ALS/FTD (n = 6) and FTD (n = 7) groupings. Both HEPACAM and TPP1 display high molecular weight species (indicated by asterisk *), representing well‐established glycosylation events on these proteins, respectively (Golabek et al, 2003; Moh et al, 2005), which were included in the quantification. Western blot for GAPDH is provided as a loading control (bottom panel). Microglial and astrocyte markers are highlighted in blue and green, respectively.
- Quantification was performed by ImageJ and statistical significance determined by ANOVA with Dunnett's post hoc test to compare each disease group to the control group (*P‐value < 0.05). Box plots depict mean (horizontal bars) and variance (25th to 75th percentiles), with whiskers extending to the last non‐outlier measurements, as shown.
- Representative immunohistochemistry images of cortex and white matter regions of the frontal cortex from case 20 (ALS) and case 30 (ALS/FTD). GFAP and HEPACAM staining in cells of the cortical layers demonstrate staining intensity in astrocytes in the frontal cortex, whereas MSN and TPP1 staining show a microglial expression pattern. The relative increase in immunoreactivity for GFAP, HEPACAM, MSN, and TPP1 in the ALS/FTD case likely reflects changes in the abundance, of astrocytes and microglia measured by proteomics in module 6 (red). Scale bars represent 50 μm in low‐power images and 20 μm in insets.