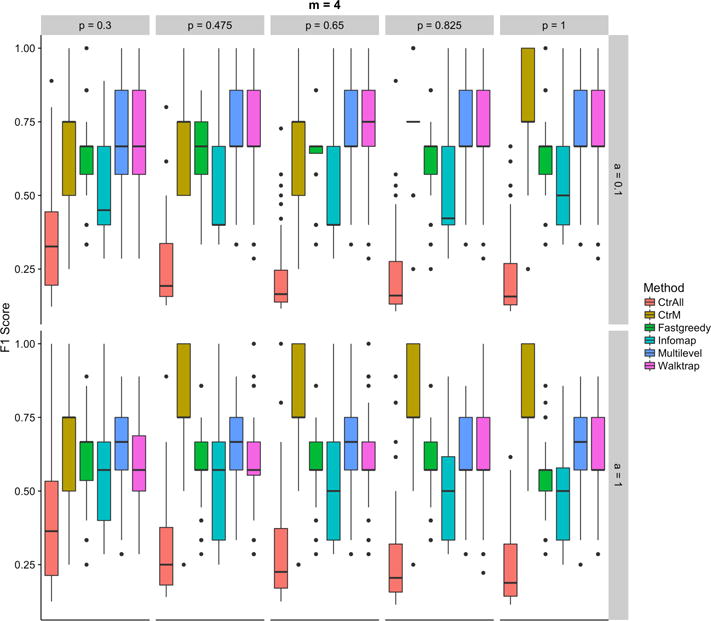
Fig. 2.

F1 scores for the controls (using all (CtrAll), or only the top 4 (CtrM), statistically significant pathways) and the community detection methods: Fastgreedy, Infomap, Multilevel, and Walktrap for various percentages of genes in each pathway (top axis) and percentages of additional genes (right side axis) for simulations using 4 random pathways. The percentage of genes indicates the percentage of random genes selected from each pathway. The percentage of additional genes indicates how many unrelated genes are randomly added to the analysis to represent increasing amounts of noise. Each comparison includes 100 iterations.
