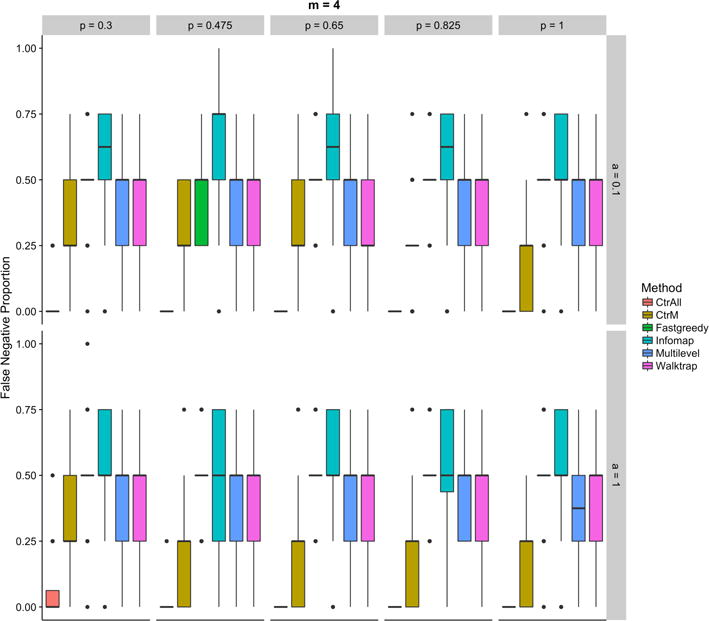
Fig. 4.

Proportions of false negatives in the controls (using all (CtrAll), or only the top 4 (CtrM), statistically significant pathways) and the community detection methods: Fastgreedy, Infomap, Walktrap, and Multilevel for various percentage of genes in each pathway (top axis) and percentage of additional genes (right side axis) for simulations using 4 random pathways.
