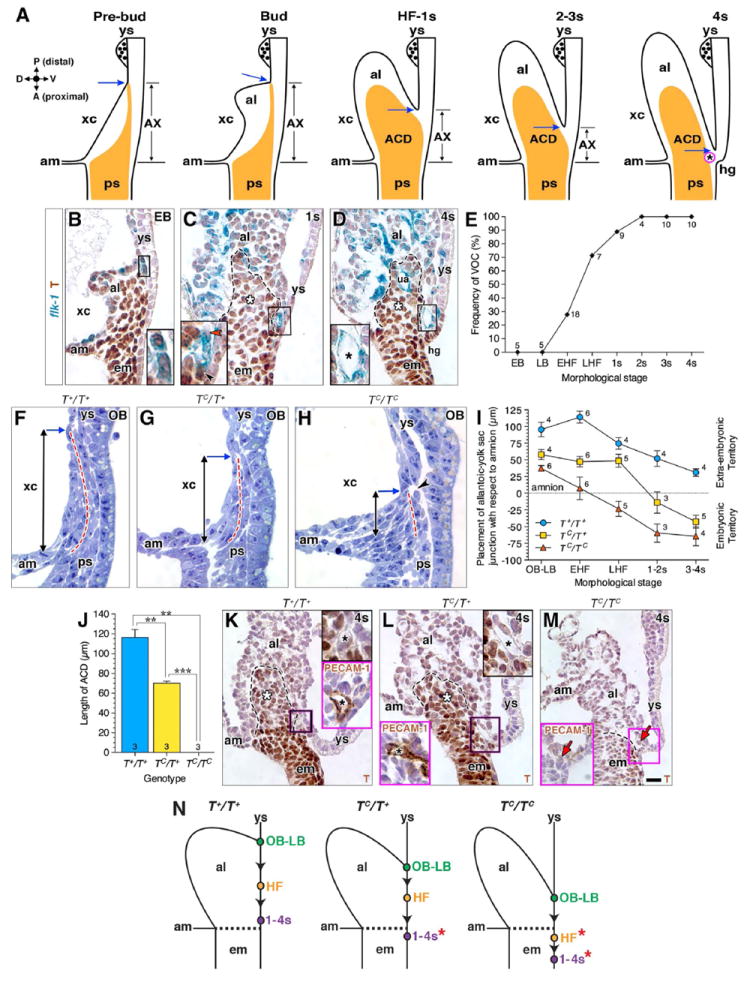
Fig. 1. Positioning the allantoic-yolk sac junction and vessel of confluence requires T.

Unless otherwise indicated, histological sections in this (B-D, K-M: paraffin wax preparation; F-H: plastic preparation) and all subsequent figures are mid-sagittal with orientation as depicted by compass in A (A, anterior (proximal); D, dorsal; P, posterior (distal); V, ventral). (A) Schematic diagram through the mid-sagittal plane of the posterior embryonic-extraembryonic interface over time; data are from previous reports (see text) regarding the allantois-associated visceral endoderm (AX), the primitive streak’s extraembryonic extension/ACD (orange), and the VOC (magenta; black asterisk). The posterior limit of the primitive streak coincides with the posterior limit of the allantoic bud’s ventral connection to the single layer of yolk sac mesoderm, called here the “allantoic-yolk sac junction” (blue arrow). (B-D) Genesis of the VOC and localization of T in the flk-1: lacZ reporter mouse strain; black dashed lines outline ACD (C, D, white asterisk). Insets are enlarged box regions in main panels. (B) T-positive angioblasts clustering at the allantoic-yolk sac junction; (C) a mixture of T-positive angioblasts (black arrowhead) and T-negative endothelializing angioblasts (red arrowhead) as the cluster matures; (D) the fully mature T-negative VOC (black asterisk). (E) Graph showing that the appearance of the endothelialized VOC begins at the early headfold stage, and is invariably present by 2s. Sample sizes are indicated at each data point. (F-H) Comparison, amongst TC littermates, of the primitive streak’s extension into the extraembryonic region (dashed red line); vertical arrows indicate the distance of this extension measured from the amnion to the allantoic-yolk sac junction (blue arrow). Arrowhead (H) indicates that the extraembryonic streak may be fragmenting. (I) Placement of the allantoic-yolk junction decreases over time amongst all TC genotypes. The mean distance ± SEM (error bars) measured vertically from the amnion, shown in (F-H) (y=0, embryonic-extraembryonic boundary); sample sizes per stage and genotype are indicated for each data point. (J) Length of ACD, depicted as mean ± SEM (error bars) with sample sizes indicated at the base of each bar; asterisk, significant P-value (Student t-Test: T+/T+ vs TC/T+, P=0.0051; T+/T+ vs TC/TC, P=0.0047; TC/T+ vs TC/TC, P=0.0009). (K-M) T immunostaining in main panels; upper right insets (K, L) are enlarged from the boxed region of the main panel, showing the VOC (black asterisk). Magenta-boxed insets (K-M) show PECAM-1 immunostaining of mid-sagittal sections through the VOC (K, L), or where the VOC should be, but is missing (red arrow, M). Black dashed lines outline the posteriormost extension of the primitive streak, which extends into the allantois (ACD, white asterisk) in K and L, but is limited to the embryo in M. (N) Schematic representation of how placement of the allantoic-yolk sac junction (color-filled dots along yolk sac) drops (arrowheads) anteriorly (proximally) over time in each genotype. Dashed line indicates embryonic-extraembryonic boundary, red asterisk highlights aberrant embryonic placement of the junction in the TC/T+ and TC/TC mutants, also indicated in (I). Scale bar (M): 10 μm (K, L magenta insets); 18 μm (B-D, F-H, K, L, M magenta inset); 25 μm (M). al, allantois; am, amnion; em, embryo; hg, hindgut; ps, primitive streak; ua, umbilical artery; xc, exocoelomic cavity; ys, yolk sac.
