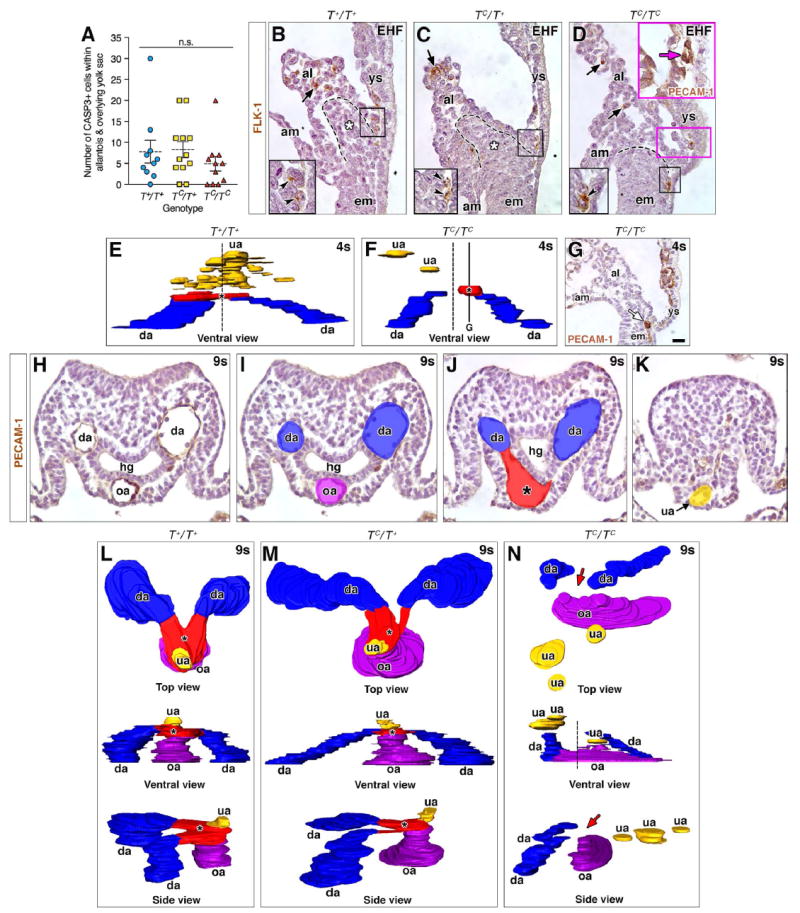
Fig. 2. Placement of the VOC, umbilical artery, and OUA connection is dose-dependent on T.

(A) Dot-box plot of CASP3+ cells in allantois and overlying yolk sac (EB-6s stages); means (dashed line), SEM (error bars); n.s., not significant (Student t-Test; T+/T+ vs TC/T+, P=0.8912; T+/T+ vs TC/TC, P=0.3714; TC/T+ vs TC/TC, P=0.2134). (B-D) Immunostaining for FLK-1 amongst TC genotypes. Black boxed insets, lower left: enlarged prospective VOC of black-boxed region in main panels. Black arrows (main panels) and arrowheads (insets): correctly patterned FLK-1 angioblasts within distal allantois and prospective VOC. Dashed lines, posteriormost extension of primitive streak (B-D); white asterisk, ACD (B, C). Magenta inset (D): a misplaced PECAM-1-positive (magenta arrow) vessel within the yolk sac near its junction with the allantois, the region of which is indicated by the magenta box in the main panel (see text). (E, F) 3D models (frontal ventral views) reconstructed from PECAM-1-immunostained nascent arterial vessels at the posterior embryonic-extraembryonic interface; dashed vertical line (E, F) marks the axial midline. Color key: blue, dorsal aortae (da); red, VOC (asterisk); yellow, umbilical artery (ua). (G) TC/TC mutant specimen immunostained for PECAM-1, sagittal section, lateral to the midline, equivalent to the solid horizontal line in F. White arrow indicates a vessel forming at the allantoic-yolk sac junction off the midline. (H-K) Examples of tissue sections used for the 3D reconstructions in (L-N). (H) PECAM-1-immunostained transverse section showing the paired da on either side of the hindgut (hg), and the omphalomesenteric artery (oa) at the ventral midline. (I-K) Colorized transverse sections from the level of the oa (H, I) and proceeding posteriorly (distally), to capture the VOC (J) and ua (K). All reconstructed sections were PECAM-1 immunostained. (L-N) Top, ventral (frontal) and side views (posterior, right) of the OUA connection in all three T genotypes, colored as described above with addition of purple for the oa. Red arrows (N) indicate missing OUA connection; vertical dashed line indicates the axial midline and the site where the VOC (red, located off center) should be located. Scale bar (G): 10 μm (D magenta inset); 20 μm (B-D, H-K), 25 μm (G). al, allantois; am, amnion; em, embryo; ys, yolk sac.
