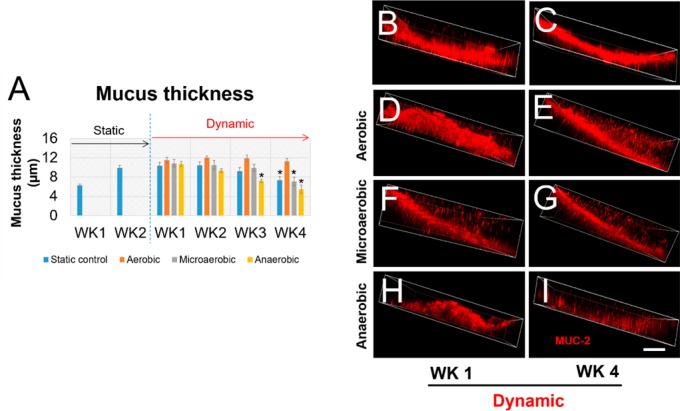
Figure 7.
Analysis of mucus thickness generated in the static culture and bioreactor cultures with oxygen control. (A) The quantification of mucus thickness. (B–G) Confocal images of MUC-2 staining on samples from different culture conditions. Scale bar = 10 μm. Data are presented as mean ± SEM, n = 5 in each group, *p < 0.001.

