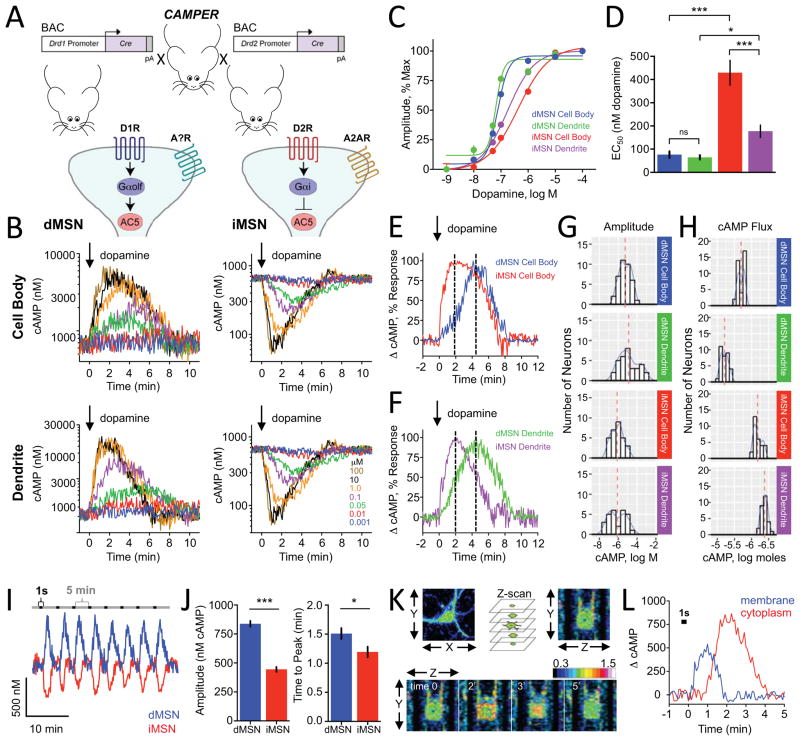
Figure 2. Benchmarking dopamine mediated signaling dynamics in cultured striatal neurons.
A) Schematics of strategy to study cAMP dynamics in genetically defined populations of striatal neurons.
B) Population responses to bath applied dopamine (at time=0) to D1R-Cre-CAMPER (dMSNs) and D2R-Cre-CAMPER (iMSNs) primary striatal neurons. 385 out of 462 (83%) of dMSNs responded to dopamine by increasing cAMP. 336 out of 429 (78%) of iMSNs responded by decreasing cAMP level. No dMSNs decreased cAMP and no iMSNs that increased cAMP.
C) Dose response curve of cAMP changes to dopamine. n≥10 neurons.
D) The EC50 values calculated from data in panel C. dMSN cell body (76.5 ± 13.9 nM dopamine), dMSN dendrite (64 ± 9.4 nM dopamine), iMSN dendrites (177.3 ± 26.2 nM dopamine) and iMSN cell body (429.5 ± 53.3 nM dopamine). Error bars indicate SEM values. * = p<0.05, *** = p<0.0001
E) Comparison of kinetic properties at equivalent sensitivity to dopamine. dMSN cell body exhibited an EC66 of 101.9 ± 14.4 nM dopamine whereas iMSN cell body had an EC66 of 1.02 ± 72.3 μM dopamine. Dotted line indicates time to peak.
F) Comparison of kinetic properties at equivalent sensitivity to dopamine. dMSN dendrites had an EC37 of 54.3 ± 10.4 nM dopamine whereas iMSN dendrites had an EC37 of 97.8 ± 12.8 nM dopamine. Normalized percent change in cAMP response was plotted for dMSN dendrite at 50 nM for comparison with iMSN dendrite at 100 nM dopamine. dMSN dendrite required 4.38 ± 0.21 minutes to reach peak response whereas iMSN dendrite required 2.04 ± 0.10 minutes. Dotted line indicates time to peak.
G) Histogram of cAMP amplitude to 100 μM dopamine. There was no difference between dMSN cell body and dMSN dendrite (non-parametric t-test; Kolmogorov-Smirnov; p=0.307) or between iMSN cell body and iMSN dendrite (p=0.2398). The dMSN cell body profile significantly differed from iMSN cell body (p<0.001) and dMSN dendrites were significantly different from iMSN dendrites (p<0.05).
H) Histogram showing population distribution of neurons according to overall change in their cAMP amount in response to 100 μM dopamine. The net flux of cAMP was significantly greater in dMSN dendrite (6333 ± 261 nmol cAMP) compared with dMSN cell body (2063 ± 74 nmol cAMP) (non-parametric t-test; Kolmogorov-Smirnov; p<0.0001). The net flux of cAMP was significantly greater in iMSN cell body (682 ± 32 nmol cAMP) compared with iMSN dendrite (425 ± 17 nmol cAMP) (non-parametric t-test; Kolmogorov-Smirnov; p<0.0001).
I) Responses of striatal neurons to phasic puffs of dopamine (1 μM) applied directly to the neuron being recorded for a brief pulse of 1 second at 5 minute intervals. Representative traces are shown from dMSN and iMSN cell body.
J) Quantification of maximum amplitude of phasic dopamine response. dMSN (838 ± 24.6 nM cAMP) was significantly larger compared with iMSN (444 ± 21.1 nM cAMP). Time to peak was significantly faster in iMSNs (1.19 ± 0.09 minutes) compared with dMSNs (1.51 ± 0.10 minutes). Error bars indicate SEM values. N=9 dMSNs and 11 iMSNs. * = p<0.05, *** = p<0.0001
K) Imaging XYZ planes at each time point during application of a single puff of dopamine (1 second; 1 μM) directly to the dMSN being recorded. Pseudocolored FRET images from one representative experiment are shown and time is displayed in minutes relative to dopamine application. LUT values displayed in ΔFRET.
L) cAMP response from membrane and cytoplasmic compartments of a dMSN following application of a single puff of dopamine (1 second; 1 μM). Data was averaged from nine neurons.

