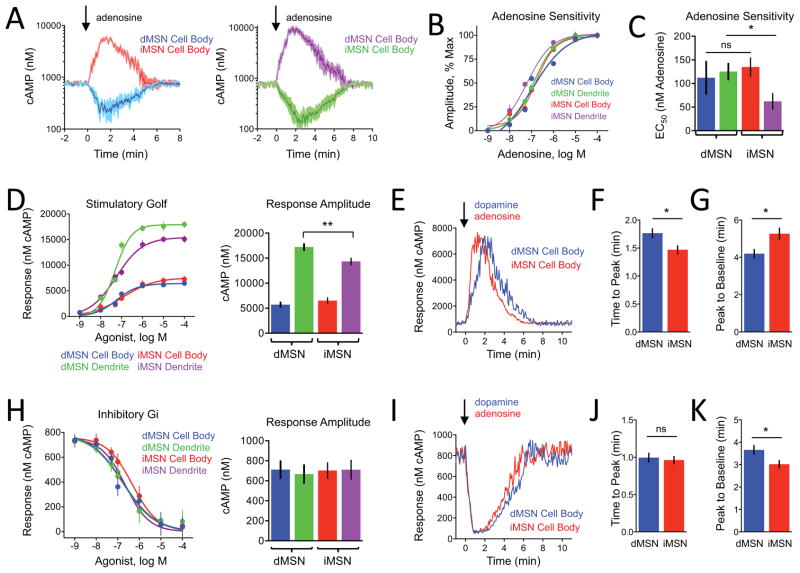
Figure 3. Probing modulation of cAMP signaling in cultured striatal neurons by adenosine.
A) Primary striatal neuron response to bath application of adenosine (1 μM). iMSNs (n=33) positively coupled to cAMP production and dMSNs (n=35 neurons) showed an inhibitory effect. Shading indicates SEM range.
B) Dose response curve of cAMP changes to adenosine. n≥10 neurons. Error bars indicate SEM values.
C) The EC50 values calculated from data in panel B. The iMSN dendrites (62 ± 17 nM adenosine) were more sensitive to than dMSN dendrites (125 ± 17 nM adenosine) whereas there was no difference between dMSN and iMSN cell body regions (112 ± 34 and 135 ± 19 nM adenosine, respectively). Error bars indicate SEM values. * = p<0.05
D) Comparison of stimulatory Gαolf-mediated responses. There was no difference in the max response at a saturating concentration (100 μM) between dMSN cell body (5701 ± 451 nM cAMP, n=37) and iMSN cell body (6518 ± 562 nM cAMP, n=34), however dMSN dendrite elicited a greater response (17215 ± 607 nM cAMP, n=33) than iMSN dendrite (14352 ± 654 nM cAMP, n=36). Error bars indicate SEM values. * = p<0.05.
E) Representative cAMP response from saturating concentration of agonist (100 μM) comparing Gαolf signaling.
F) Time to peak at a saturating concentration of agonist (100 μM), dMSN cell body was significantly slower to reach peak response (1.77 ± 0.08 min, n=37) than iMSN cell body (1.47 ± 0.07 min, n=34). Error bars indicate SEM values. * = p<0.05
G) Peak to baseline at a saturating concentration of agonist (100 μM), response termination was significantly faster in dMSN cell body (4.20 ± 0.22 min, n=37) than in iMSN cell body (5.27 ± 0.29 min, n=34). Error bars indicate SEM values. * = p<0.05
H) Comparison of inhibitory Gαi-mediated. There were no differences in the max response elicited at a saturating concentration (100 μM) of agonist between dMSN cell body (711 ± 84 nM cAMP, n=33) and iMSN cell body (702 ± 78 nM cAMP, n=29) or between dMSN dendrite (667 ± 89 nM cAMP, n=36) or iMSN dendrite (711 ± 94 nM cAMP, n=28). Error bars indicate SEM values.
I) Representative cAMP response from saturating concentration of agonist (100 μM) comparing Gai signaling.
J) Time to peak at a saturating concentration of agonist (100 μM), there was a difference in time-to-peak for responses between dMSN (0.99 ± 0.06 min, n=33) cell body and iMSN cell body (0.96 ± 0.05 min, n=29). Error bars indicate SEM values.
K) Peak to baseline at a saturating concentration of agonist (100 μM), response desensitization in dMSN cell body (3.66 ± 0.20 min, n=33) was significantly slower compared with iMSN cell body (3.02 ± 0.17 min, n=29). Error bars indicate SEM values. * = p<0.05.

