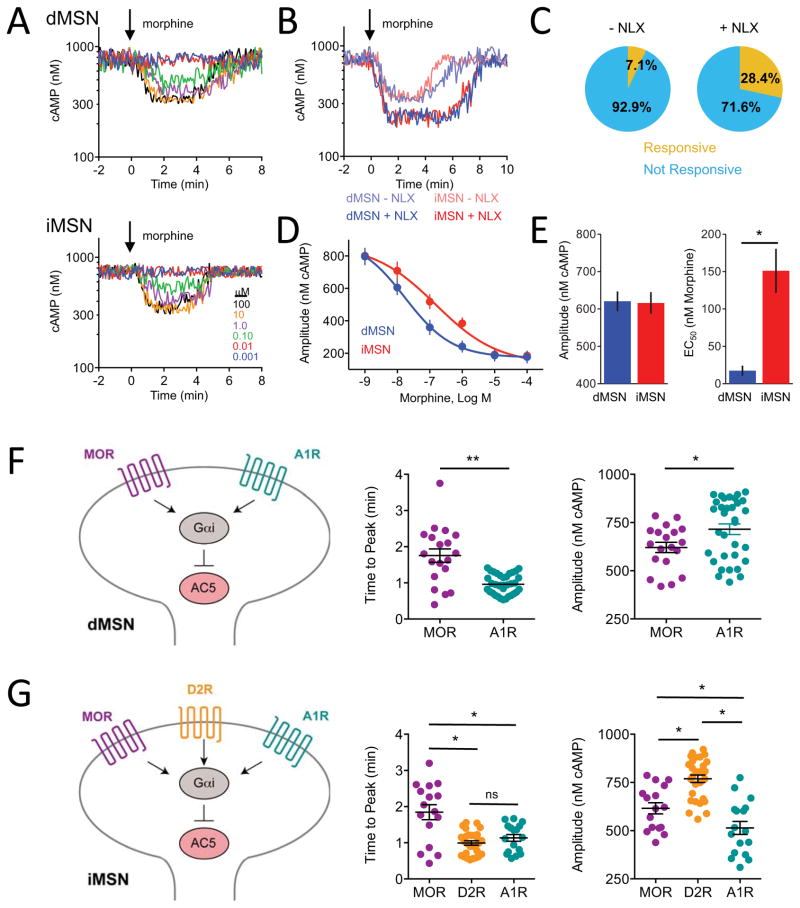
Figure 5. Modulation of cAMP responses in cultured striatal neurons by opioids.
A) Responses to neurons to morphine in dMSNs (25 out of 302) and iMSNs (22 out 313).
B) Then effect of pretreatment with 50 nM naloxone on subsequent responses to morphine (1 μM).
C) Naloxone pretreatment increased the number of responsive neurons from 7.1% (combined dMSNs and iMSNs, n=615) to 28.4% (combined dMSNs and iMSNs, n=356). No differences in behavior of dMSNs and iMSNs neurons were noted.
D) Dose response curve of cAMP changes to morphine from naloxone pretreated neurons. n≥7 neurons. Error bars indicate SEM values.
E) Response efficacy and potency. Max amplitude of cAMP responses to morphine did not differ between dMSNs and iMSNs (p>0.05) The EC50 was significantly lower for dMSNs (17.4 ± 6.7 nM morphine) than iMSNs (151 ± 29.5 nM morphine). Error bars indicate SEM values. * = p<0.05.
F) Comparison of inhibitory Gαi inputs on dMSN. MOR stimulation produced peak response significantly slower (1.75 ± 0.19 min, n= 19) than A1R stimulation (0.96 ± 0.05 min, n= 33) at a saturating concentration of agonist. The response magnitude of MOR-driven response was significantly smaller (621 ± 26 nM cAMP, n= 19) than that of A1R (715 ± 27 nM cAMP, n= 33). Error bars indicate SEM values. * = p<0.05, ** = p<0.001.
G) Comparison of inhibitory Gαi inputs on iMSNs. MOR stimulation produced peak response significantly slower (1.84 ± 0.20 min, n= 16) than D2R (0.99 ± 0.06 min, n= 29) or A1R stimulation (1.12 ± 0.09 min, n= 17) at a saturating concentration of agonist. There was no difference in activation time between D2R and A1R-mediated responses. D2R stimulation had a significantly greater response magnitude (769 ± 20 nM cAMP, n= 29) compared with MOR (616 ± 29 nM cAMP, n=16) or A1R (514 ± 34 nM cAMP, n= 17). MOR stimulation was significantly greater than A1R stimulation. Error bars indicate SEM values. * = p<0.05

