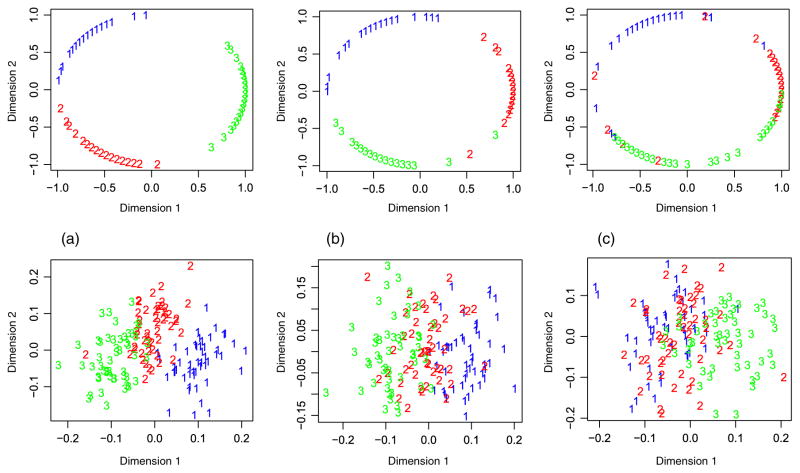
Fig. 1.
Plots of the first two dimensions after dimension reduction by both methods compared for each case. Panels (a–c) and Panels (d–f) correspond to Cases 1–3, respectively. Here, irGTM, iCluster denote the proposed method (irGTM1) and iCluster of ref. [8], respectively. [Color figure can be viewed in the online issue, which is available at wileyonlinelibrary.com.]

