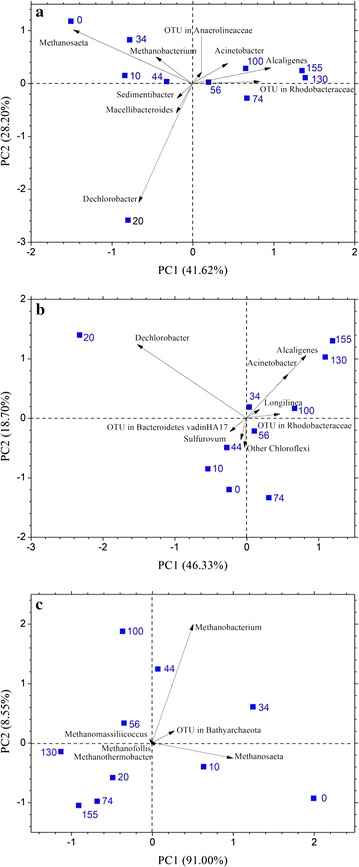
Fig. 6.

Principal component analysis based on the proportion of sequence numbers. a Total microbiomes. b Bacteria. c Archaea. The samples from day 0, 10, 20, 34, 44, 56, 74 represent the inoculum, phase I, II, III, IV, V and VI, respectively, the samples from day 100, 130 and 155 represent phase VII
