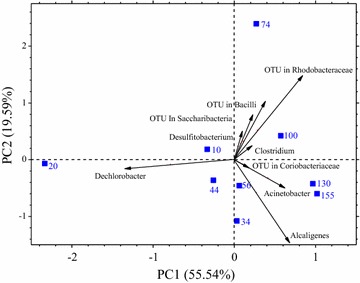
Fig. 7.

Principal component analysis based on the ratio of relative abundance of microbes compared with the inoculum culture. The samples from day 10, 20, 34, 44, 56, 74 represent phase I, II, III, IV, V and VI, respectively, the samples from day 100, 130 and 155 represent phase VII
