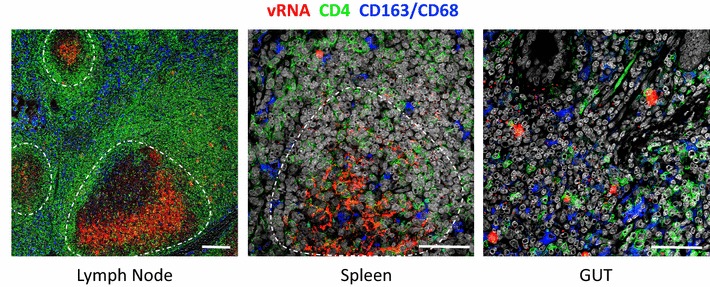
Fig. 4.

Combining RNAscope with immunofluorescent confocal analysis of specific cell protein markers. Representative images of lymph node, spleen, and gut combining RNAscope (red) with staining for CD4 (green) to identify T cells and a combination of CD163 and CD68 (blue) to identify myeloid/macrophage cells. Scale bars 200 μm
