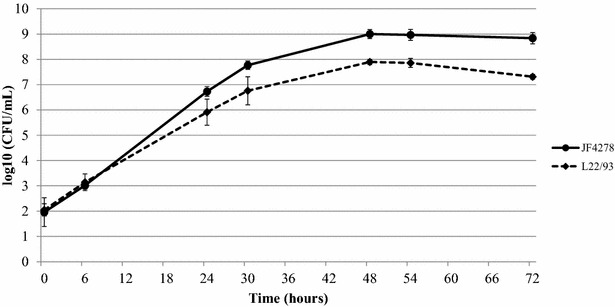
Figure 1.

Growth curves of M. bovis in axenic medium. The straight line represents strain JF4278, while the dashed line represents strain L22/93. The x-axis indicates the timepoints and the y-axis the log10 CFU/mL. The data shown are the mean values of three independent experiments. Standard deviations of individual measurements per time point are indicated as vertical bars.
