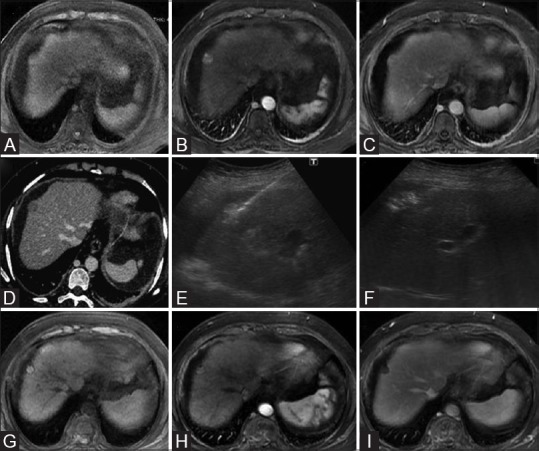
Figure 1(A-I).

Baseline contrast MRI of liver showing a T1 isointense (A) solitary arterial enhancing surface nodule (B) which subsequently shows washout in venous phase image (C) consistent with HCC. Axial CT scan image in venous phase also confirm the washout in this nodule (D). Grey scale ultrasound image (E) showing RFA electrode needle entering the tumor nodule and multitinned electrode prongs after deployment. Ultrasound image showing hyperechoic ablated area (F) covering the entire tumor nodule. Follow-up multiphase contrast MRI images taken 1 month after ablation [unenhanced (G), arterial (H), and delayed (I)] shows no enhancing component within the targeted lesion in keeping with complete response according to m-RECIST criteria
