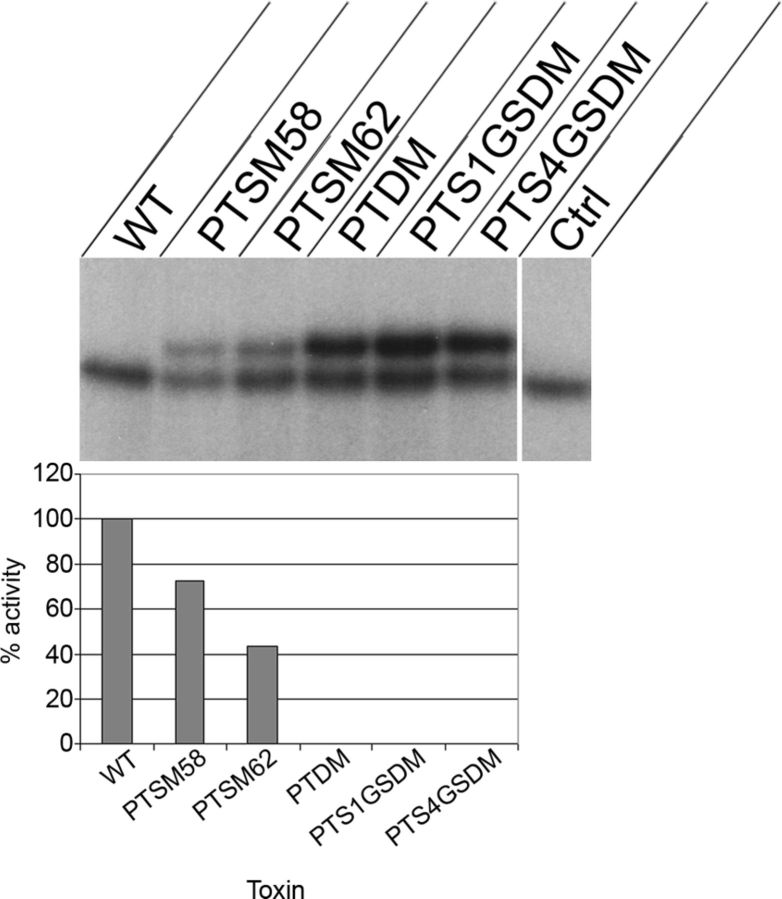
Figure 1.
Cellular ADP-ribosylation assay. Upper panel: CHO-K1 cells were incubated with the indicated toxins (2 nM) for 3 h, and the post-nuclear supernatant was used as substrate in an ADP-ribosylation assay. The upper band (41 kDa) represents radiolabeled Giα; a faint or absent band indicates a high level of toxin activity in cells. The lower band represents endogenously labeled protein and is PT independent, as shown by inclusion of a reaction in which PT was not present in the in vitro portion of the assay (Ctrl). WT: native PT. Lower panel: data were analyzed by densitometry. Cellular activities of modified forms of PT are expressed as percentage of activity of native PT. These data are representative of two similar experiments.

