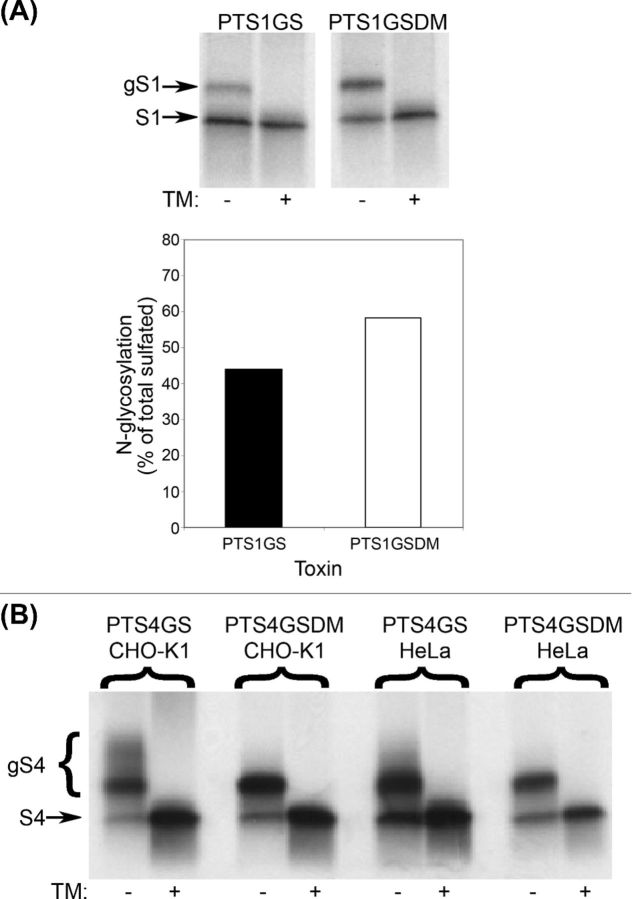
Figure 5.
Sulfation assays. CHO-K1 or HeLa cells were incubated for 24 h with the indicated toxins (20 nM) in the presence of radioactive sulfate and in the absence (–) or presence (+) of TM (1 μg/ml). The lower band represents S1 or S4 that was tyrosine sulfated in the TGN, whereas the upper band(s) (gS1 or gS4) represents S1 or S4 that was also N-glycosylated in the ER (and therefore higher molecular weight). Pretreatment of cells with TM, an inhibitor of N-glycosylation, prevented appearance of the upper band(s). (A) HeLa cells were incubated with PTS1GS or PTS1GSDM. Upper panel, fluorograph; lower panel, densitometric analysis, showing the percent N-glycosylated of total sulfated S1. Data plotted are the means of the results of two independent experiments. (B) CHO-K1 or HeLa cells were incubated with PTS4GS or PTS4GSDM.

