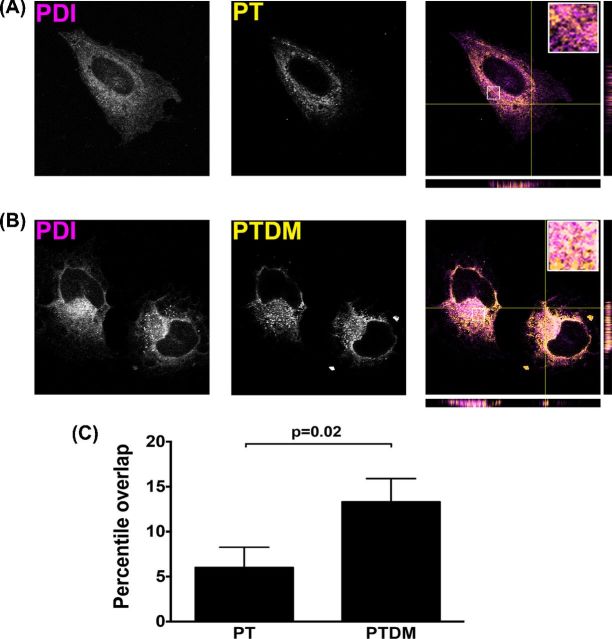
Figure 6.
Colocalization of PTDM and ER markers. HeLa cells were treated with 20 nM native PT (A) or PTDM (B) for 3 h, fixed and permeabilized. Cells were then stained with a rabbit polyclonal antibody to PT and with a mouse monoclonal antibody to the ER marker PDI. Secondary antibodies were Alexa Fluor 488 goat anti-mouse IgG (pseudocolored magenta) and Alexa Fluor 594 goat anti-rabbit IgG (pseudocolored yellow). The inserts show an enlarged area from each to emphasize the difference in the extent of colocalization. (C) The percentage colocalization (overlap) was determined using the GDSC Stack Colocalization Analyser plugin for ImageJ (n = 3).

