Abstract
Purpose
To develop, test, evaluate and apply a novel tool for the white matter fiber-based analysis of T1w/T2w ratio maps quantifying myelin content.
Background
The cerebral white matter in the human brain develops from a mostly non-myelinated state to a nearly fully mature white matter myelination within the first few years of life. High resolution T1w/T2w ratio maps are believed to be effective in quantitatively estimating myelin content on a voxel-wise basis. We propose the use of a fiber-tract-based analysis of such T1w/T2w ratio data, as it allows us to separate fiber bundles that a common regional analysis imprecisely groups together, and to associate effects to specific tracts rather than large, broad regions.
Methods
We developed an intuitive, open source tool to facilitate such fiber-based studies of T1w/T2w ratio maps. Via its Graphical User Interface (GUI) the tool is accessible to non-technical users. The framework uses calibrated T1w/T2w ratio maps and a prior fiber atlas as an input to generate profiles of T1w/T2w values. The resulting fiber profiles are used in a statistical analysis that performs along-tract functional statistical analysis. We applied this approach to a preliminary study of early brain development in neonates.
Results
We developed an open-source tool for the fiber based analysis of T1w/T2w ratio maps and tested it in a study of brain development.
1. INTRODUCTION
The white matter of the human brain develops from a mostly non-myelinated state to a nearly fully mature white matter myelination within the first few years of life. Quantification of this myelination process is the goal of a number of brain development studies, especially also of interest with application to neurodevelopmental disabilities (1). The myelination process has been widely analyzed using Diffusion Tensor Imaging (DTI), mainly through the use of DTI property maps Fractional Anisotropy and Radial Diffusivity. However, the measures are also sensitive to several brain maturation or pathological processes, such as fiber organization/wiring, axonal size and fiber density. Thus, more specific measures need to be taken to obtain information specific to myelin maturation via component analysis of T1 and T2 relaxation (2). The ratio of T1w to T2w signal intensity has been employed to show variations in myelin between cortical grey matter in (3) and thus can be used to perform myelin-based analysis of the brain. We believe that the pattern of myelin variation is also of interest in white matter. The raw T1w/T2w ratio map effectively removes the receive field bias that is consistent between T1w and T2w images. In order to apply it in quantitative analysis, an additional intensity calibration process is needed to correct raw T1w/T2w ratio image biases in intensity and contrast.
In our earlier work (1), we employed standard region of interest (ROI) analysis using regional segmentation from structural MRIs of the same subject. The use of ROIs for this purpose is relatively simple and robust against imperfect registration. However, ROI-analysis results in spatially non-specific findings as ROIs can contain multiple fiber tracts and multiple fiber situations (single, fanning, crossing fiber situations). Moreover, since ROI methods usually perform segmentation based on lobar regions, each region may not include the full range of a fiber bundle. ROI-analysis thus leads to a limited localization of findings. As shown in figure 1, quantitative tractography performs anatomically informed segmentation on volumetric data to acquire curvilinear regions that are fiber-specific, as discussed in (2). Since myelination is a process that happens along fiber bundles across the brain, a fiber-tract-based analysis via T1w/T2w ratio maps that effectively separates fiber bundles to associate effects with fiber tracts rather than large, broad region is more suited to our goal.
Figure 1.
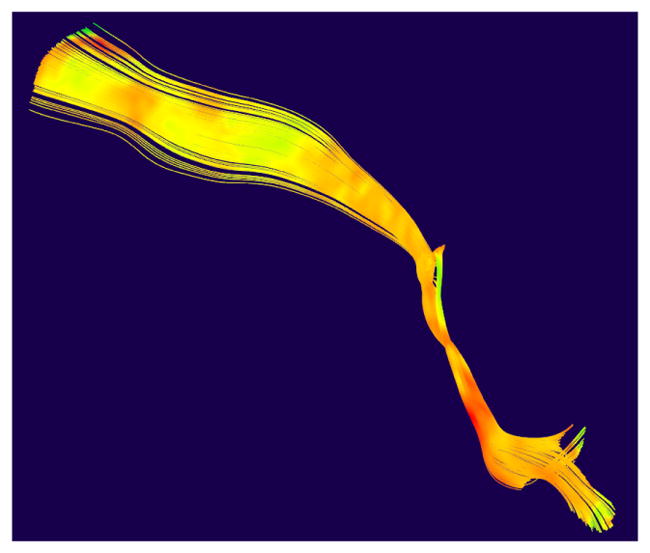
Fiber Tractography of the CorticoFugal Left Motor bundle, overlaid with T1w/T2w ratio values
In a previous study (2), our lab has developed the NA-MIC framework for fiber-tract-based DTI analysis, in which labelmap based tractography has been performed via 3D Slicer (https://www.slicer.org/) to define DTI fiber bundles. (2) also shows the building of the DTI atlas and the definition of the major fiber tracts employed in our study. We then use that DTI fiber atlas as the fiber reference, as well as the deformation fields to all subject data (see below) for registering T1w/T2w ratio values into the DTI atlas space.
In this paper, we propose a novel framework to quantify and analyze T1w/T2w ratio data along fiber tracts in a straightforward manner. At the heart of this frame-work is a GUI based analysis tool developed for non-technical users to map T1w/T2w ratio map data, deformation data and fiber data to produce T1w/T2w ratio fiber profiles that give meaningful statistically results for studies of white matter. Several steps are handled via integrated modules to perform the registration process and statistical analysis. First, the user selects the subjects of analysis via the GUI. Then, the pipeline employs modified modules of the NA-MIC framework for fiber-tract-based DTI analysis (2) to sample T1w/T2w ratio values at all locations on the fiber tracts and then extract T1w/T2w ratio profiles along these fibers. Our submission has limited methodological novelty, and its major novelty lays in the development and open-source availability of a tool to intuitive do the proposed analysis, as well as the preliminary novel results of tract-wise of white matter content development in the infant brain. The source code is available at https://github.com/NIRALUser/DTIProcessToolkit. A PowerPoint tutorial is also available at the repository to guide non-technical users to use the GUI. That tutorial has also been appended to this document.
2. METHODS AND MATERIALS
Our framework for the fiber tract based analysis of T1w/T2w ratio maps is composed of four components:
Computation of T1w/T2w Ratio Maps
Diffusion Fiber Atlas Registration
Extraction of T1w/T2w Ratio Profile
Statistical Analysis
The workflow is visualized in figure 2. All of the tools referenced in the description of our workflow can be utilized as stand-alone command line applications to facilitate scripting. Each component takes certain data subjects as input and produces output for the next step.
Figure 2.
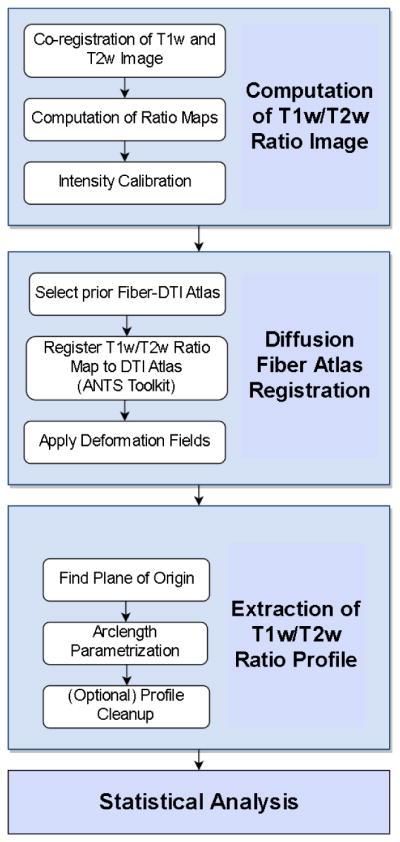
The workflow of our framework
2.1 Subjects and Acquisition
We applied our T1w/T2w-ratio map analysis to neonate datasets acquired on a Siemens Tim Trio 3T scanner at the University of Irvine (UCI). Children were scanned unsedated while asleep, fitted with ear protection and with their heads secured in a vacuum-fixation device. High-resolution T1-weighted images were acquired with a 3D magnetization prepared rapid gradient echo (MP-RAGE TR = 1820 ms, inversion time = 1100 ms, echo time = 4.38 ms, flip angle = 7 degrees, resolution = 1 × 1 × 1 mm3, 6.18 mins). A high-resolution 3D T2-weighted sequence was also acquired at the same Field Of View and resolution as the T1w image (TR = 32000 ms, echo time = 255 ms, 4.18 mins). A total of 73 subjects (40 male, 33 female) were used here, ranging in gestational age at scan from 1 to 10 weeks.
From this data, we used the following information for the analysis:
T1w/T2w Ratio Maps, already calibrated as in (1)
DTI Atlas Fiber Reference determined as in (2)
Deformation Fields to DTI Fiber Reference, generated during the construction of DTI Atlas.
2.1.1 T1w/T2w Ratio Maps
High-resolution T1w images and T2w images are acquired in many neuroimaging studies. The computation of T1w/T2w ratio maps, as the first component of our framework, includes a calibration procedure to prepare the ratio maps for quantitative studies as described in detail in (1). We applied the following steps to compute the T1w/T2w ratio values:
Rigid registration of the T1w image into standard MNI space
Rigid registration of the T2w image to its aligned T1w image (1)
Computation of the T1w/T2w ratio maps from (1) and (2)
Intensity calibration of T1w/T2w maps via atlas based region statistics using deformable atlas registration.
Register the T1w/T2w maps into the corresponding DTI atlas space for fiber tract based analysis via the NA-MIC atlas based fiber tract analysis framework.
The calibrated T1w/T2w ratio images need to be registered and transformed to the fiber bundles of interest, which will be discussed in section 2.1.3.
2.1.2 DTI Fiber Reference
We employed a prior white matter fiber atlas (4) that was generated via the NA-MIC atlas based fiber analysis toolkit (2) and consists of all major fiber bundles (see result section). First, a deformable, unbiased DTI atlas was created via a tool called DTIAtlasBuilder, which serves as the global reference space. Then, fiber tract streamline DTI tractography was performed via 3D slicer (http://www.slicer.org) in the DTI atlas space followed by fiber cleaning with FiberViewerLight (www.nitric.org/projects/fwlight). Tractography was performed for major fiber bundles: corpus callosum (genu, rostrum, tapetum, occipital, parietal), Left(L)/Right(R) cingulum, L/R fornix, L/R inferior fronto-occipital fasciculus, L/R inferior longitudinal fasciculus, L/R superior longitudinal fasciculus, L/R uncinate fasciculus, L/R motor, L/R premotor, L/R corticofugal parietal and L/R thalamocortical parietal and L/R optic tracts. The resulting inputs are therefore fiber bundles registered in the aforementioned DTI atlas space.
2.1.3 Deformation to DTI Fiber Reference
In order to bring the T1w/T2w ratio maps into the atlas space, we need in addition to the DTI atlas deformation fields, which maps information to/from the atlas space and the individual DTI space, also deformable transforms that take the individual T1w/T2w ratio maps from its individual structural space into the corresponding individual (same subject) DTI space. These intra-scan DTI to T1w/T2w transforms were computed via a strongly regularized, symmetric diffeomorphic image registration with the ANTS toolkit (5). The final deformation fields are computed by combining the corresponding pairs of deformation fields, which map the individual T1w/T2w ratio maps directly to the global DTI atlas.
2.2 Fiber Sampling in T1s/T2w Maps
After subjects are selected, the tool deforms the reference fibers into the individual T1w/T2w ratio map space and samples (trilinear interpolation) the ratio values at all deformed fiber locations. The next step extracts T1w/T2w ratio profiles along the fiber tracts akin to (2) using an fiber center plane initialized arc-length parametrization and average property computation at uniformly spaced arc-length intervals. Additional data cleaning can be performed for the profiles for quality control via the DTI statistics tool FADTTSter.
The necessary tools in the NA-MIC atlas based fiber analysis toolkit were adapted for this purpose.
2.3 Tract Profile Extraction
Prior to statistical analysis, a final step needs to be performed to extract T1w/T2w ratio properties along the fiber tracts. Our method is based on the method to generate diffusion property profiles in (2). For this purpose, a fiber tract parametrization is performed based on fiber arc length. The origins are calculated by intersecting each fiber with an origin plane at the median fiber location, orthogonal to the average fiber orientation at that location, as shown in figure 3. Each fiber point will be then parametrized by its signed arc-length distance to that origin plane. This process is done by the dtitractstat module to generate scalar profile data registered along the fiber tracts. While the module automatically determines this origin plane, investigators can choose to provide a prior origin plane for the analysis instead. The output of this step is a set T1w/T2w parameter profiles stored in csv format. Additional data cleaning can be performed for the profiles for quality control via the DTI statistics tool FADDSter.
Figure 3.
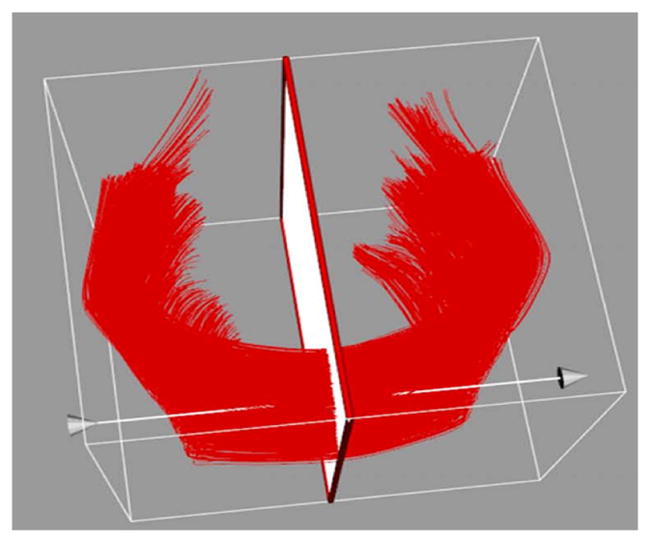
A visualization of the plane function intersecting genu fiber
2.4 Statistical Analysis
To test how T1w/T2w ratio values relate to other variables of interest, we analyze the obtained profiles via the FADTTS method developed in (6). FADTTS is a statistics method specialized for analysis of DTI-based fiber studies. Since T1w/T2w ratio values are essentially scalar values applied on fiber tracts in our study, the tool is easily adaptable for our purpose. It applies a multi-variate coefficient model, weighted least squares estimation and functional principal component analysis. The analysis produces both global and arc-length-based local statistics with confidence bands and local p-values corrected for multiple comparisons with false discovery rate (FDR). FADTTS was applied via the GUI-based tool FADTTSter developed at the NIRAL.
2.5 Open Source Tool
Direct access of the tool to non-technical users is a crucial requirement in software development for neuroscience studies. To facilitate interaction with the framework, we developed a multi-platform GUI software named ScalarFiberAnalyzer (see figure 4) based on Qt (http://www.qt.io/) and CMake (https://cmake.org/). The input of the GUI is the T1w/T2w ratio map, the DTI fiber atlas reference and the deformation fields. The output of the GUI is the T1w/T2w fiber profiles as discussed in Section 2.3. Two external modules, fiberprocess and dtitractstat, were also adapted to be used by ScalarFiberAnalyzer to execute the pipeline of the framework. To facilitate debugging and re-execution, the GUI generates a python script that runs the entire pipeline of the framework. The project can be accessed at https://github.com/NIRALUser/DTIProcessToolkit.
Figure 4.
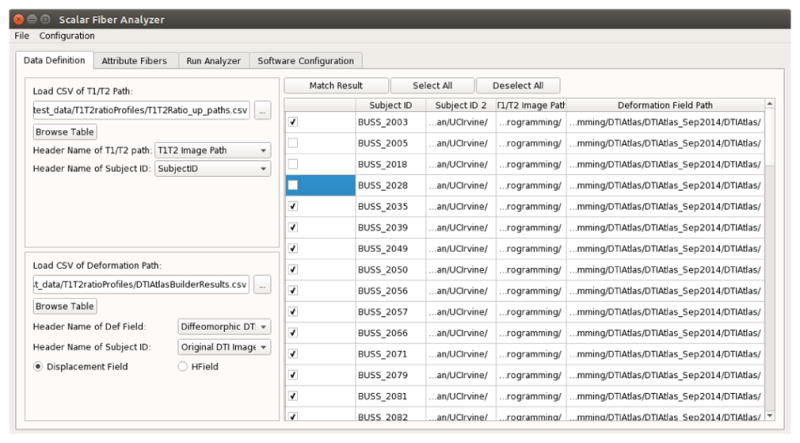
A Screenshot of ScalarFiberAnalyzer
Via the GUI, the T1w/T2w ratio map and deformation field inputs are specified according to the input csv files that contain the paths to the data. The GUI will automatically match the T1w/T2w ratio maps with deformation field paths via the case ids. After the information matching process, the fiber tracts of interest can be selected for which the T1w/T2w ratio map analysis is performed. The user also needs to specify configurations for paths to external modules being used by the pipeline script, namely the executable path of python, fiberprocess and dtitractstat. The GUI utilizes a QtGUI framework, developed at UNC, such that users can save and load their specified parameters and configurations. Once configuration and selection are complete, the entire pipeline can be executed by hitting a single run button. Outputs of the GUI are stored as extracted fiber profiles in csv format, which can be further analyzed statistically.
3. RESULTS
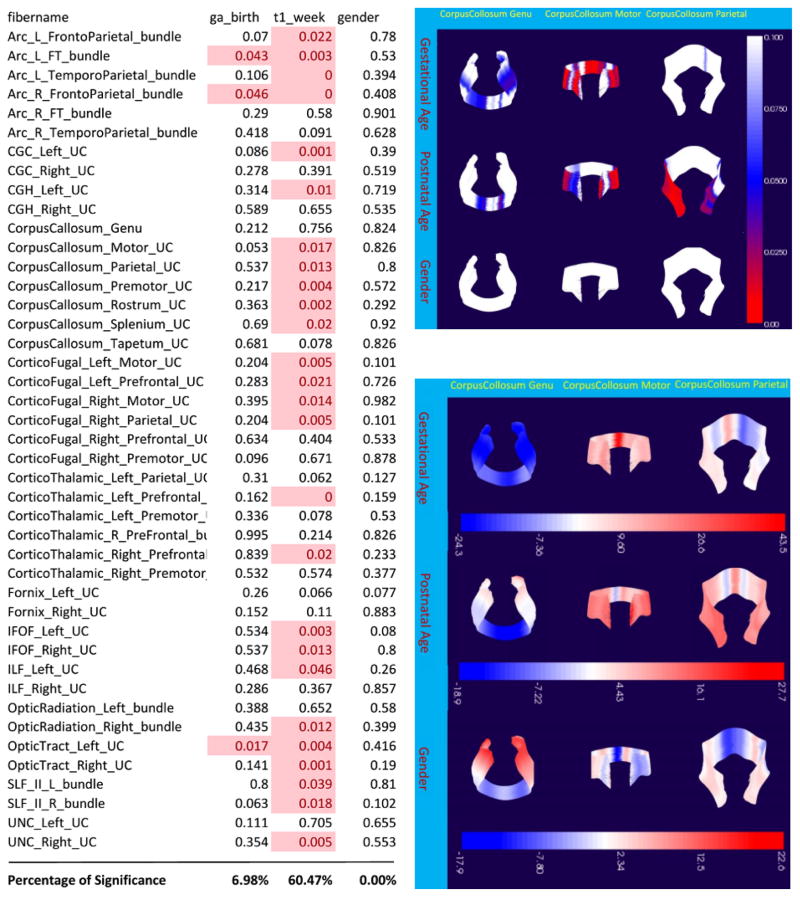
For testing our proposed framework, we conducted an example study using data from 73 neonate subjects that are part of a pediatric study conducted at UC Irvine (7). The T1w/T2w ratio maps and diffusion fiber data are processed by the GUI to generate fiber profiles that sample the T1w/T2w ratio maps of every subject along every fiber bundle in our data. With our statistical tool discussed in section 2.4, we computed the multivariate coefficients and the corresponding post-hoc p values of the association of the T1w/T2w ratio profiles with the following three covariates: postnatal age at scan (by week), gestational age at birth (by week) and sex. Figure 5 shows the p-value results for the corpus callosum Genu, Motor and Parietal bundles. Each column of the visualizations is the fiber bundle of interest, and each row is the variable of interest. The blue and red color mapping on each fiber marks the regions that show statistical significance in the correlations. In this figure, we can see that sex is not a significant factor for all three fiber bundles, while gestational age at birth contributes significantly to the variations of T1w/T2w ratio value in most regions on the motor region of corpus callosum and the peripheral part of the genu in the frontal lobe. Furthermore, the association with postnatal age at scan is most significant around the peripheral parts of the corpus callosum motor and parietal regions. Figure 6 shows the multivariate coefficients of these factors across all three example fiber bundles. The blue color marks regions that show negative correlation, while the red color marks the positive correlation. For regions that show the strongest statistical significance, we can see that gestational age at birth and postnatal age at scan mainly have a positive correlations with T1w/T2w ratio (does it meet with any neuroscience hypothesis?), except for the center region of the genu, which is negatively correlated to these two covariates.
Figure 5.
Results on selected fiber bundles. The left table shows the global p-values for all fibers. The upper right figure shows the p-value visualization (clamped to be within 0 to 0.1). The red color marks statistical significance.
4. DISCUSSION AND CONCLUSION
This paper presents a framework for diffusion fiber-based analysis of T1w/T2w ratio maps to study myelination in white matter. Our main contribution is the development of the software tool that implements pipeline functionality for our proposed framework. With our implementation, statistical analysis can be performed on T1w/T2w ratio distribution on individual fiber bundles to gain insight into how myelination in white matter may be correlated with different factors. We tested this analysis framework on a study of neonate brain development with preliminary results shown. As mentioned before, a more in-depth analysis and interpretation of these results will be one of our next steps.
Acknowledgments
This work was supported by the National Institutes of Health (MH064065, MH070890, MH091351, MH091645, HD079124, HD03110).
References
- 1.Lee K, Cherel M, Budin F, Gilmore J, Consing KZ, Rasmussen J, Wadhwa PD, Entringer S, Glasser MF, Van Essen DC, et al. Early postnatal myelin content estimate of white matter via t1/t2w ratio. International Society for Optics and Photonics. 2015:94171R–94171R. doi: 10.1117/12.2082198. [DOI] [PMC free article] [PubMed] [Google Scholar]
- 2.Verde AR, Budin F, Berger J-B, Gupta A, Farzinfar M, Kaiser A, Ahn M, Johnson H, Matsui J, Hazlett HC, et al. Unc-utah na-mic framework for dti fiber tract analysis. Front Neuroinform. 2014;7(51):3389. doi: 10.3389/fninf.2013.00051. [DOI] [PMC free article] [PubMed] [Google Scholar]
- 3.Glasser MF, Essen DCV. Mapping human cortical areas in vivo based on myelin content as revealed by t1- and t2-weighted MRI. The Journal of Neuroscience. 2011;31(32):11597–11616. doi: 10.1523/JNEUROSCI.2180-11.2011. [DOI] [PMC free article] [PubMed] [Google Scholar]
- 4.Lee SJ, Steiner RJ, Luo S, Neale MC, Styner M, ZHU H, Gilmore JH. Quantitative tract-based white matter heritability in twin neonates. Neuro Image. 2015 Feb;111:123–135. doi: 10.1016/j.neuroimage.2015.02.021. [DOI] [PMC free article] [PubMed] [Google Scholar]
- 5.Avants BB, Tustison NJ, Song G, Cook PA, Klein A, Gee JC. A reproducible evaluation of ANTs similarity metric performance in brain image registration. Neuro Image. 2011 Feb;54:2033–2044. doi: 10.1016/j.neuroimage.2010.09.025. [DOI] [PMC free article] [PubMed] [Google Scholar]
- 6.ZHU H, Kong L, Li R, Styner M, Gerig G, Lin W, Gilmore JH. FADTTS: functional analysis of diffusion tensor tract statistics. Neuro Image. 2011 Jun;56:1412–1425. doi: 10.1016/j.neuroimage.2011.01.075. [DOI] [PMC free article] [PubMed] [Google Scholar]
- 7.Graham AM, Buss C, Rasmussen JM, Rudolph MD, Demeter DV, Gilmore JH, Styner M, Entringer S, Wadhwa PD, Fair DA. Implications of newborn amygdala connectivity for fear and cognitive development at 6-months-of-age. Developmental cognitive neuroscience. 2015 Oct; doi: 10.1016/j.dcn.2015.09.006. [DOI] [PMC free article] [PubMed] [Google Scholar]


