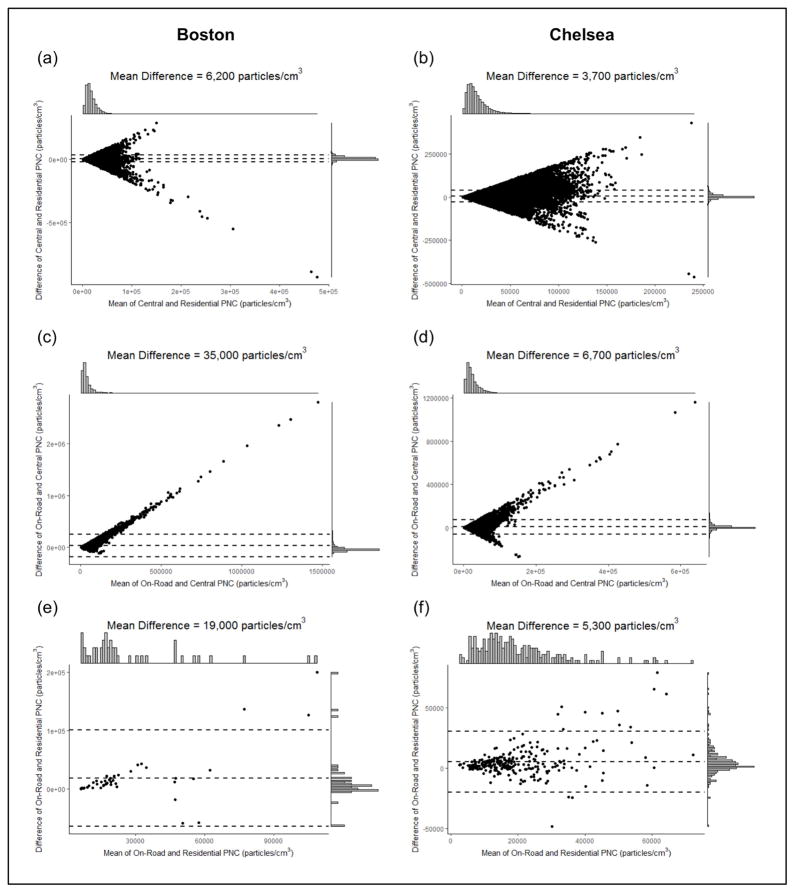
Figure 4.
Bland-Altman plots of the mean PNC measured by the two platforms being compared (x-axis) versus the difference in measured PNC (y-axis). Differences from zero indicate positive or negative differences between the platform listed first in the axis label relative to the second. Trending tendencies above zero indicate systematic positive differences. The center dashed line represents the mean difference; the outer dashed lines represent ± two standard deviations from the mean difference. The distribution of data can be determined by the histograms along the x2 and y2 axes. (a,b) Comparisons between central-site and residential-site PNC; (c,d) comparisons between central-site and on-road PNC; (e,f) comparisons between residential and on-road PNC.

