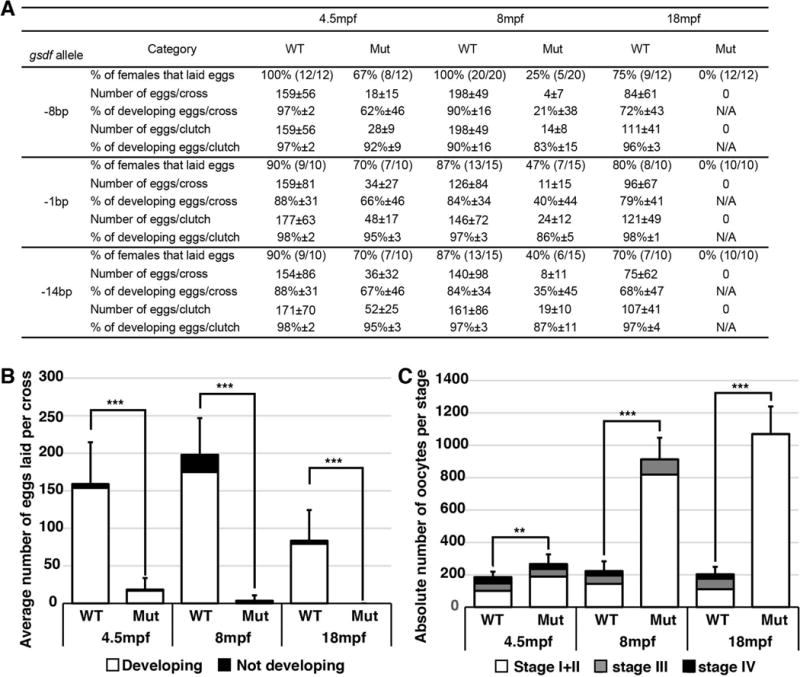
Figure 3.

Fertility in gsdf mutant lines. A. Fertility data for the three mutant gsdf alleles compared to wild-type siblings. For each allele, the percentage of females that laid eggs is given and in parentheses appears the number of crosses yielding eggs compared to the number of crosses performed. Other quantities and percentages are given with their respective standard deviation. B. Average number of eggs laid per cross of -8bp gsdf mutant females compared to wild-type siblings at 4.5, 8 and 18 mpf. For each of 12 to 20 crosses for mutant or wild-type genotypes, one wild-type female or one mutant female was paired with three non-sibling wild-type males. Eggs were collected and counted the following day, and their development was followed for at least three days. Eggs developing normally, not developing, or improperly developing were counted. C. Number of oocytes in histological sections of fish homozygous for the -8bp gsdf mutation compared to wild-type siblings at 4.5, 8 and 18 months post fertilization (mpf). Oocytes were categorized in three groups: Stage I + Stage II (white), Stage III (grey) and Stage IV (black) oocytes. The 18 mpf mutant females had only Stage I + Stage II oocytes. Statistical significance: **, 0.01<p<0.001 and ***, p< 0.001.
