Figure 6.
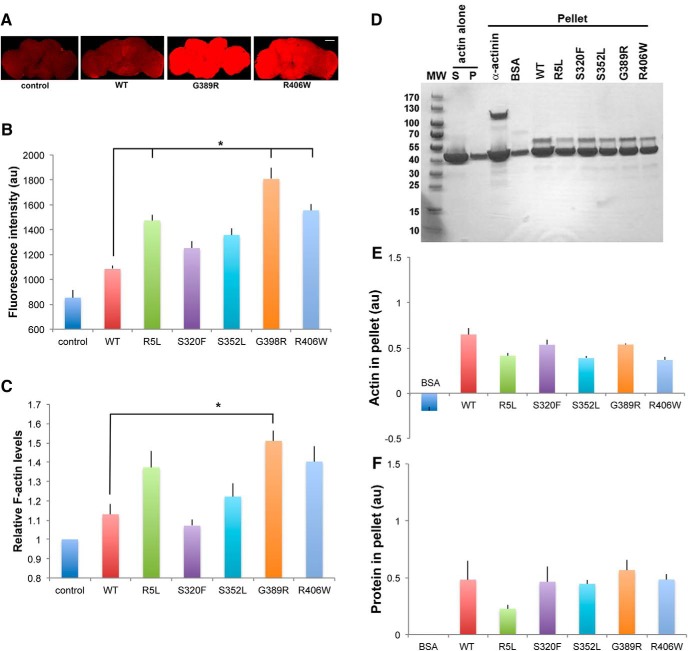
Interaction of tau with actin in vivo and in vitro. A, F-actin staining with fluorescent phalloidin in whole fly brains from flies expressing tau using the pan-neuronal elav-GAL4 driver. Scale bar, 50 μm. B, Quantitative analysis of phalloidin fluorescence in the brains of control animals or flies expressing human wild-type or FTDP-17 mutant forms of tau. Three brains were analyzed per genotype. C, F-actin ELISA in homogenates of brains from control animals or flies expressing human wild-type or FTDP-17 mutant forms of tau. Each experiment was performed with two technical replicates. The experiments were repeated three times. *p < 0.05, ANOVA with Tukey's HSD. Full statistical analysis is presented in Figure 6-1. Control is elav-GAL4/+. Full genotypes are provided in Figure 6-1. Flies are 30 d old. D–F, Increased amounts of F-actin are recovered in the pellet following incubation with α-act as a positive control or with human wild-type or FTDP-17 mutant forms of tau (D), as assessed by quantitative analysis of the amount of pelleted actin (E) or protein bound in the pellet (F). BSA is used as a negative control. The experiment was repeated twice.

