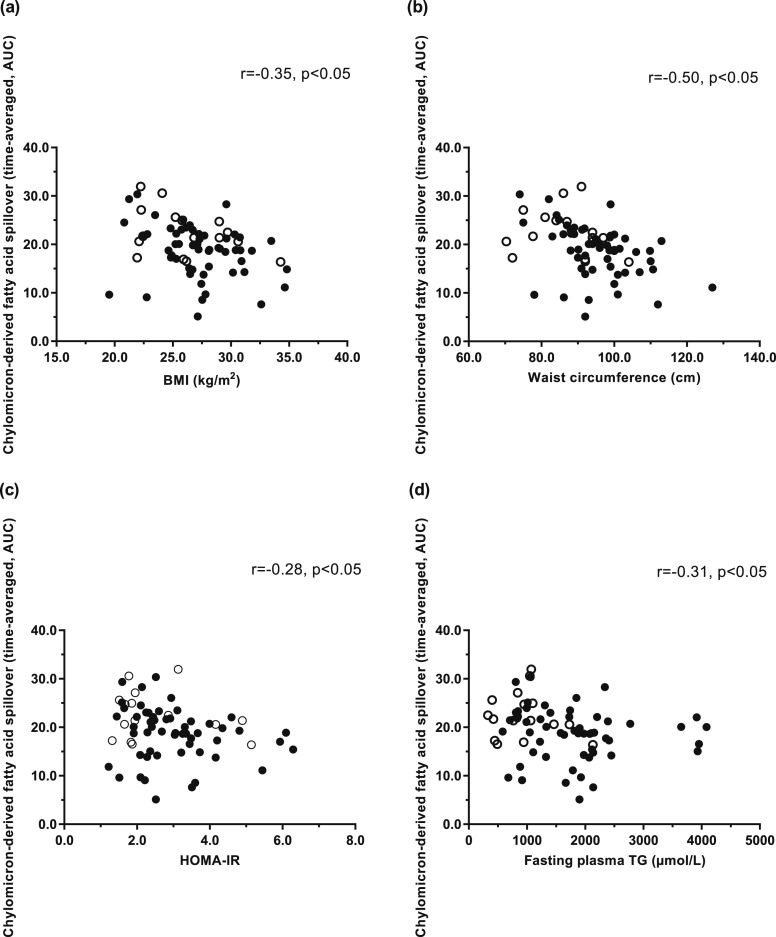
Figure 4.
Correlations between the contribution of chylomicron-derived fatty acid spillover (time-averaged, AUC) to the plasma NEFA pool and (a) BMI (women: rs = −0.31; P = NS; men: rs = −0.33, P = 0.02); (b) waist circumference (women: rs = −0.36, P = NS; men: rs = −0.46, P = 0.0004); (c) HOMA-IR (women: rs = −0.23, P = NS; men: rs = −0.25, P = NS); and (d) fasting plasma TG concentrations (women: rs = −0.23, P = NS; men: rs = −0.22, P = NS) in women (n = 16) (white circle) and men (n = 55) (black circle).

