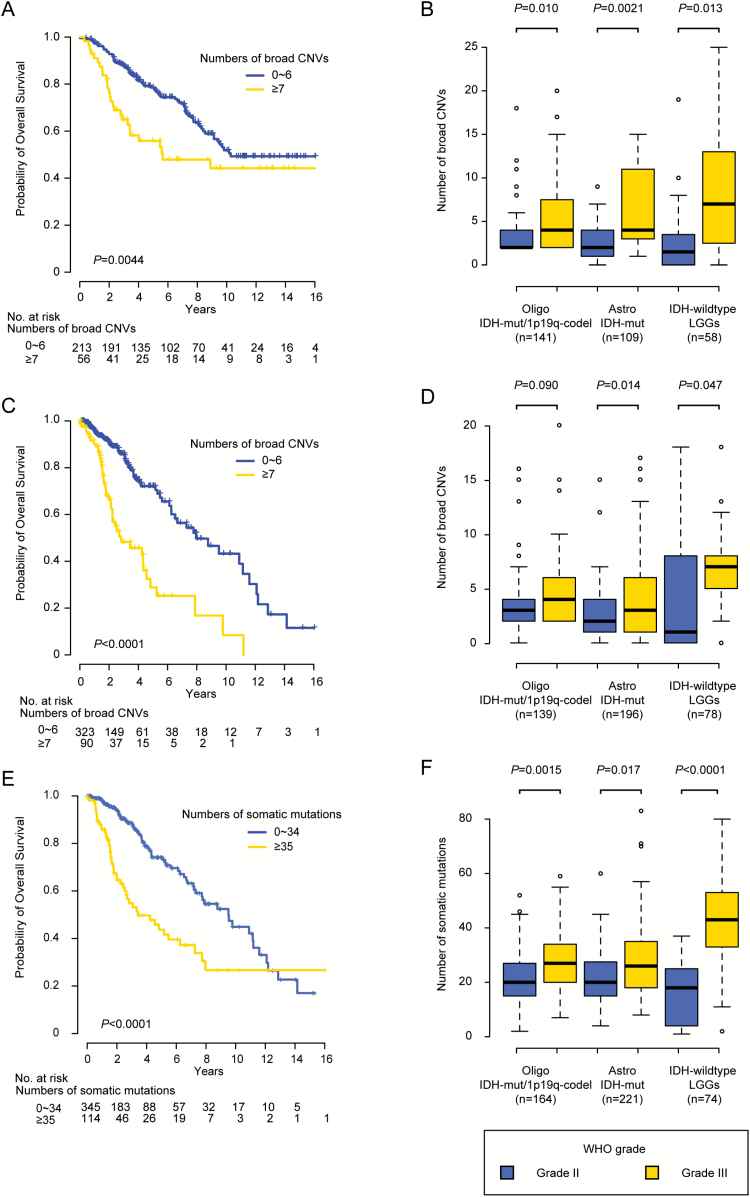
Fig. 1.
Association of genetic alterations with clinicopathological features. (A) Kaplan–Meier curves of OS of LGG patients in the JPN cohort, classified based on the number of broad CNVs. (B) Mean numbers of broad CNVs in each molecular subtype in the JPN cohort plotted with 25% and 75% quartiles according to WHO grade. (C) Kaplan–Meier curves of LGG patients in the cohort from TCGA, classified based on the number of broad CNVs. (D) Mean numbers of broad CNVs of each molecular subtype in the cohort from TCGA, plotted with 25% and 75% quartiles according to WHO grade. (E) Kaplan–Meier curves of LGG patients in the combined JPN and TCGA cohort, classified based on the number of somatic mutations. (F) Mean numbers of somatic mutations of each molecular subtype in the combined JPN and TCGA cohort, plotted with 25% and 75% quartiles according to WHO grade. Oligo = oligodendroglioma; Astro = astrocytoma.

