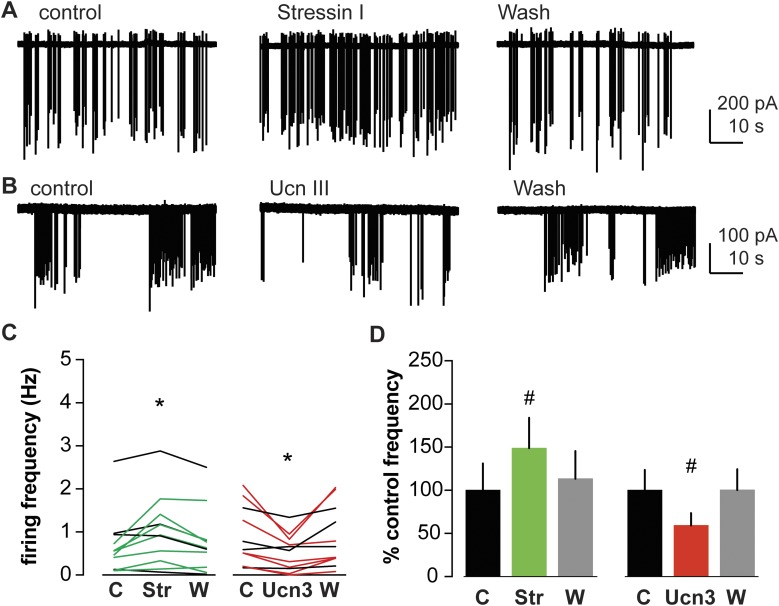
Figure 3.
Activation of specific CRHRs has different effects on GnRH neuron firing activity. (A and B) Representative raw data from extracellular recordings of GnRH neurons during control (left), CRHR agonist treatment periods (stressin I, top center; Ucn III, bottom center), and wash periods (right). (C) Firing frequency of individual GnRH neurons during control (C), treatment [stressin I (Str) or Ucn3 (Ucn III)], and wash out (W) periods. Green and red lines indicate cells with 30% increase or decrease in firing frequency during treatment, respectively. *P < 0.05 mean firing frequency compared with control period, two-way repeated-measure ANOVA/Tukey. (D) Mean ± SEM percentage of control firing frequency. #P < 0.05 compared with control period, Friedman test/Dunn post hoc.

