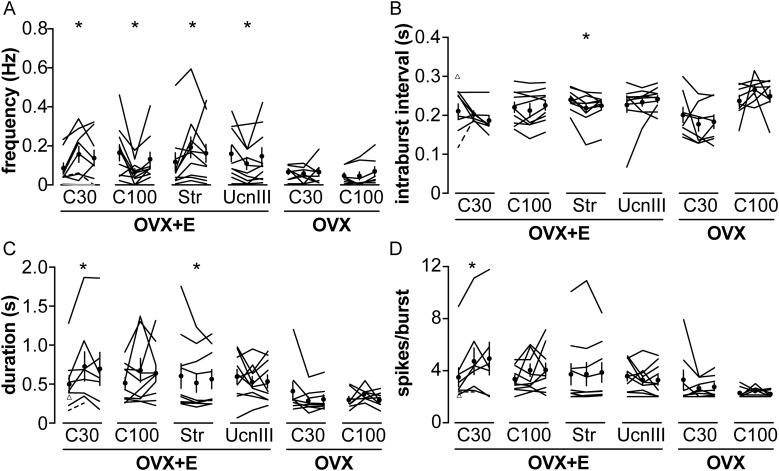
Figure 4.
CRH alters GnRH neuron burst firing pattern in OVX+E mice. (A) Burst frequency of individual GnRH neurons during the control, treatment, and wash periods analyzed in Figs. 1–3. (B) Intraburst interval, (C) burst duration, and (D) spikes/burst of individual GnRH neurons. Values from the same cell are connected by lines. Mean ± SEM are shown as a circle with error bar in (A–D). Triangles in (B–D) indicate control burst parameter values of a cell in the C30 group that had bursts during the control period but not during CRH treatment [gray line in (A)]. Dashed lines in (A–D) connect control and treatment burst parameters of a cell in the C30 group that exhibited bursts during the control and treatment periods but only single spikes during the wash period. *P < 0.05 control vs treatment, two-way repeated-measure ANOVA/Tukey for CRH treatments and Friedman test/Dunn for stressin I and Ucn III. C30, 30 nM CRH; C100, 100 nM CRH; Str, stressin I.

