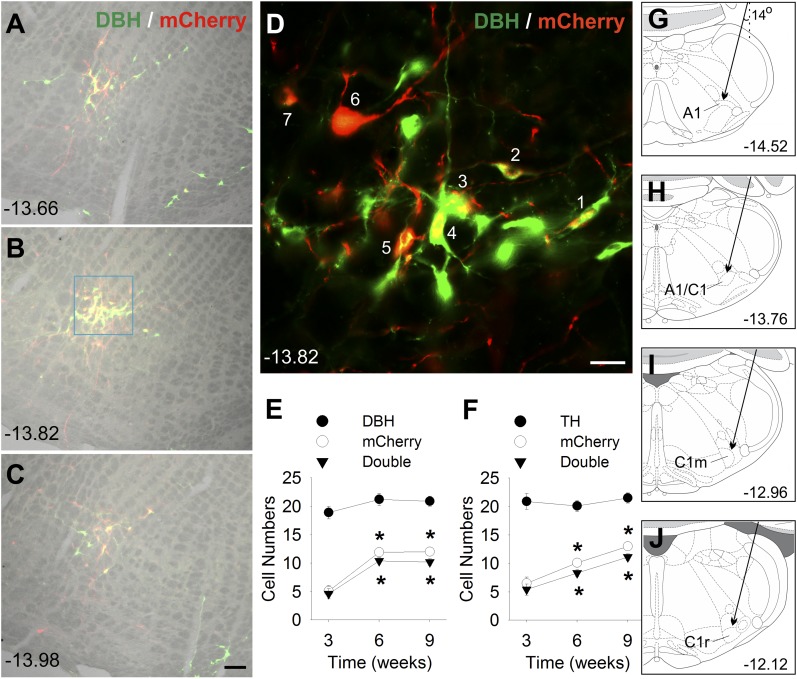
Figure 1.
DBH/mCherry and TH/mCherry staining in A1/C1 region in Th-Cre+ rats. (A–C) DBH/mCherry double staining in A1/C1 6 weeks after bilateral AAV-hM3D injection into A1/C1 of a female Th-Cre+ rat. Merged images of bright-field image (gray) and double IF staining of DBH (green) and mCherry (red) at three rostrocaudal levels. (D) High-magnification IF image of DBH and mCherry of the area shown in the light blue square in B. All seven mCherry-positive cells (indicated by a number) in this image were also DBH-positive. Cell counts of (E) DBH/mCherry or (F) TH/mCherry staining in A1/C1 area at 3, 6, and 9 weeks after AAV-hM3D injection into A1/C1. Numbers were averages per side of 9 to 12 sections from three to four Th-Cre+ rats (three sections per rat). *P < 0.001 vs values at 3 weeks (by post hoc Student-Newman-Keuls test after one-way analysis of variance). Scale bar = 100 µm in A to C and 25 µm in D. (A– D) Distance (in millimeters) caudal to bregma is shown. (G–J) Schematic drawings showing the target site for AAV injection into A1, A1/C1, C1m, and C1r regions, respectively. Arrows indicate the calculated trajectory of the glass capillary pipette inserted into VLM at a 14-degree angle. Distance (in millimeters) caudal to bregma, at approximately the middle of each injection site, is shown.

