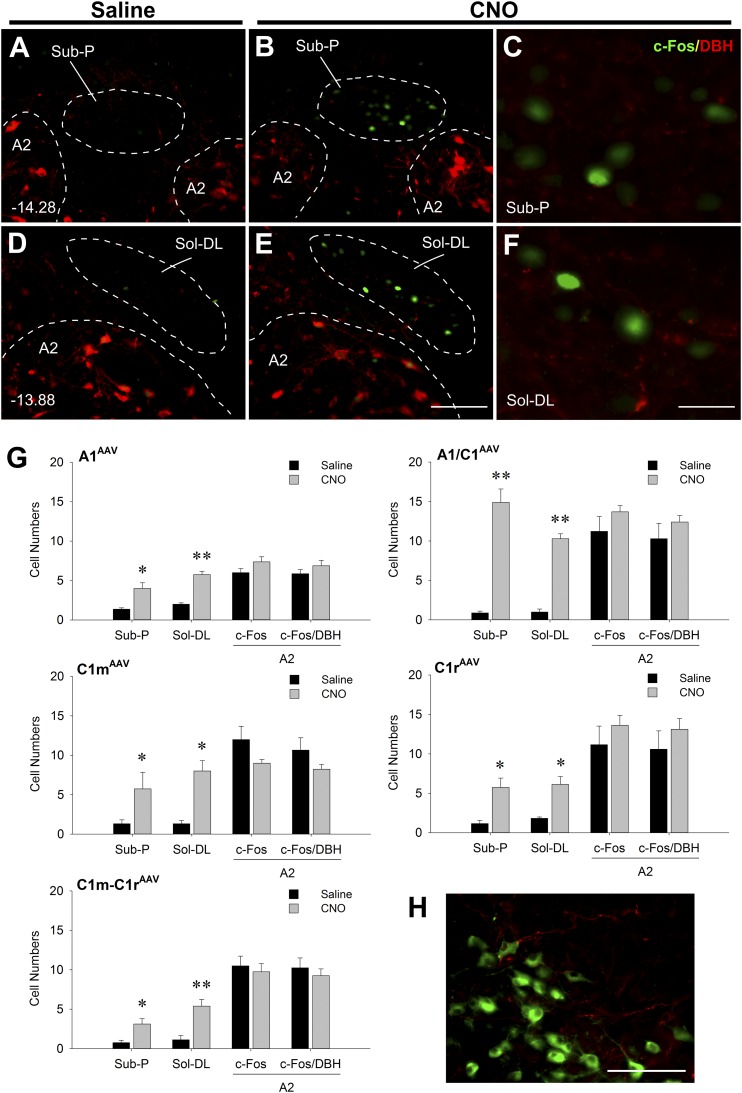
Figure 4.
Expression of c-Fos, DBH, and mCherry in DMM of Th-Cre+ rats virally transfected in the VLM and euthanized 2 hours after saline or CNO injection (1 mg/kg intraperitoneally) in the absence of food. (A–F) Representative double IF images at two rostrocaudal levels of the DMM showing c-Fos (green) and DBH (red) in DMM in A1/C1AAV-hM3D rats. (C and F) High magnification of areas in (B) and (E) showing strong c-Fos expression and surrounding DBH terminal staining, respectively. Distances (in millimeters) caudal to bregma are shown in (A) and (D). Scale bar = 100 µm (for A, B, D, and E). Scale bar = 25 µm (for C and F). (G) Cell counts of c-Fos and c-Fos/DBH in Sub-P area, solitary nucleus, dorsolateral region (Sol-DL), and A2 regions in A1AAV-hM3D, A1/C1AAV-hM3D, C1mAAV-hM3D, C1rAAV-hM3D, and C1m+C1rAAV-hM3D rats. Numbers are averages of 6 to 10 sections from three to five rats (two sections per rat). *P < 0.01; **P < 0.001 vs saline-injected control (by unpaired t test). (H) A representative double IF image of DBH (green) and mCherry (red) in DMM in a C1mAAV-hM3D rat showing mCherry-positive fibers and the absence of mCherry-positive cell bodies in A2 and Sol-DL. Scale bar = 100 µm.

