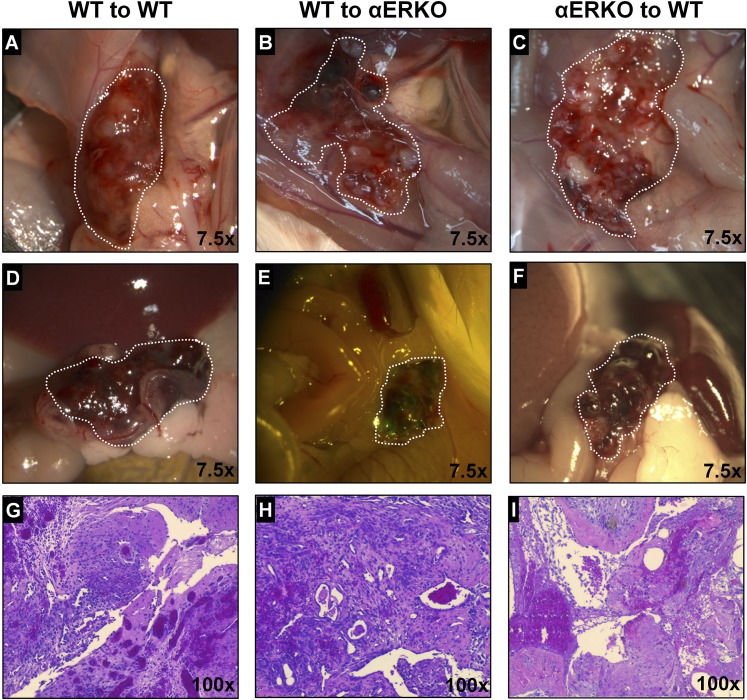
Figure 1.
Endometriosis lesion macroscopic and microscopic appear similar 72 hours after disease initiation. (A–F) Gross appearance of lesions (×7.5) in WT to WT (left column), WT to αERKO (middle column), and αERKO to WT (right column). Lesions in A–C are localized to the injection site. Lesions in D–F are localized throughout the peritoneal cavity. Lesions are outlined by dotted white line. (G–I) Histological evaluation (hematoxylin and eosin) of lesion tissue (×100). Representative examples are E2 treated.

