Figure 3.
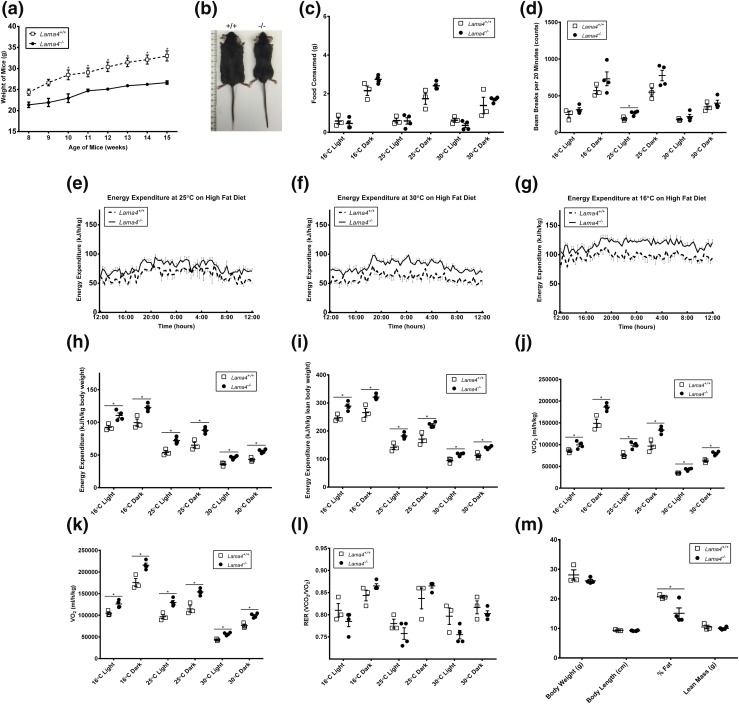
Lama4−/− mice phenotype on HFD. (a) Average body weight of mice fed HFD: Lama4−/−, n = 6 (weeks 8 to 10), n = 9 (weeks 11 to 12), and n = 13 (weeks 13 to 15); Lama4+/+, n = 10 (weeks 8 to 10), n = 14 (weeks 11 to 12), and n = 20 (weeks 13 to 15). Data are presented as mean ± standard error of the mean (SEM) with *P < 0.05 as significant from repeated-measures ANOVA. (b) Lama4−/− mice remained lean compared with control mice when fed HFD at age 15 weeks; ruler is in centimeters. (c) Average food consumption of mice fed HFD (Lama4−/− mice, n = 4; Lama4+/+ mice, n = 3). Data are presented as mean ± SEM with *P < 0.05 as significant from repeated-measures ANOVA. (d) Average total movements in the x direction by mice fed HFD (Lama4−/− mice, n = 4; Lama4+/+ mice, n = 3). Data are presented as mean ± SEM with *P < 0.05 as significant from repeated-measures ANOVA. (e) Average EE of mice housed at 25°C and fed HFD (Lama4−/− mice, n = 4; Lama4+/+ mice, n = 3). Data are presented as mean ± SEM with *P < 0.05 as significant from repeated-measures ANOVA. (f) Average EE of mice housed at 30°C and fed HFD (Lama4−/− mice, n = 4; Lama4+/+ mice, n = 3). Data are presented as mean ± SEM with *P < 0.05 as significant from repeated-measures ANOVA. (g) Average EE of mice housed at 16°C and fed HFD (Lama4−/− mice, n = 4; Lama4+/+ mice, n = 3). Data are presented as mean ± SEM with *P < 0.05 as significant from repeated-measures ANOVA. (h) Average EE of mice fed HFD normalized to body weight (Lama4−/− mice, n = 4; Lama4+/+ mice, n = 3). Data are presented as mean ± SEM with *P < 0.05 as significant from repeated-measures ANOVA. (i) Average EE of mice fed HFD normalized to lean weight (Lama4−/− mice, n = 4; Lama4+/+ mice, n = 3). Data are presented as mean ± SEM with *P < 0.05 as significant from repeated-measures ANOVA. (j) Average VCO2 levels during a 12-hour dark cycle (Lama4−/− mice, n = 4; Lama4+/+ mice, n = 3). (k) Average VO2 levels during a 12-hour dark cycle at each temperature: 16°C, 25°C, and 30°C (Lama4−/− mice, n = 4; Lama4+/+ mice, n = 3). Data are presented as mean ± SEM with *P < 0.05 as significant from repeated-measures ANOVA. (l) Average respiratory exchange ratio (RER) during a 12-hour dark cycle at each temperature: 16°C, 25°C, and 30°C (Lama4−/− mice, n = 4; Lama4+/+ mice, n = 3). Data are presented as mean ± SEM with *P < 0.05 as significant from repeated-measures ANOVA. (m) DEXA analysis of percent fat and lean tissue mass In mice (Lama4−/− mice, n = 4; Lama4+/+ mice, n = 3). Data are presented as mean ± SEM with *P < 0.05 as significant from two-tailed Student t test.

