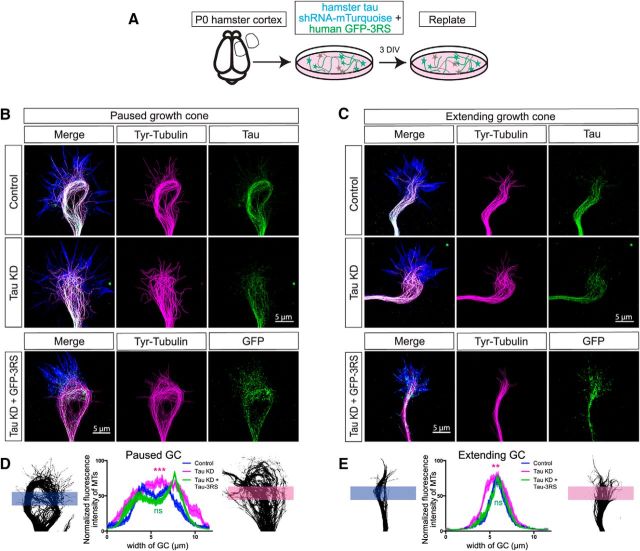
Figure 4.
Tau knockdown disrupts microtubule bundling, which is restored with human tau expression. P0 hamster cortical neurons were dissociated and nucleofected with a tau sh2 knockdown construct tagged with mTurquoise and replated after 3 DIV (A). In STED images of control growth cones (B, top row) tyrosinated MTs (magenta) are tightly bundled and form a characteristic loop in the central region of pausing growth cones. Antibodies to total tau (green) follow the organization of the bundled MTs. In the merged image tau colocalizes with the bundled MTs (white) and individual dynamic MTs extend into the growth cone periphery labeled with phalloidin to stain actin filaments (blue). In extending growth cones (C, top row) tyrosinated MTs (magenta) are also bundled but extend in straight trajectories and do not form loops. Tau (green) colocalizes (white) with bundled MTs. Following tau knockdown (B, C, middle row) tyrosinated MTs (magenta) in the growth cone center become unbundled and disorganized. Following rescue with tau expression (B, C, bottom row) MTs (magenta) are restored to bundles. Exogenous tau is shown in green. Fluorescence intensities across line scans of the growth cone center in control versus tau knockdown neurons measure the degree of MT bundling (D, E). Paused control growth cones (n = 20 growth cones) show two peaks of fluorescence (blue line) reflecting MT bundles in the left and right sides of the MT loop. In contrast following tau knockdown fluorescence is evenly distributed (magenta line) reflecting the lack of MT bundling (D). Fluorescence measurements of extending growth cones (n = 20) also show bundled MTs in controls versus splayed MTs following tau knockdown (E). In both graphs restoration of MT bundling with tau expression are indicated by the green line. ns - not significant, **p < 0.01, ***p < 0.001. Scale bar, 5 μm.

