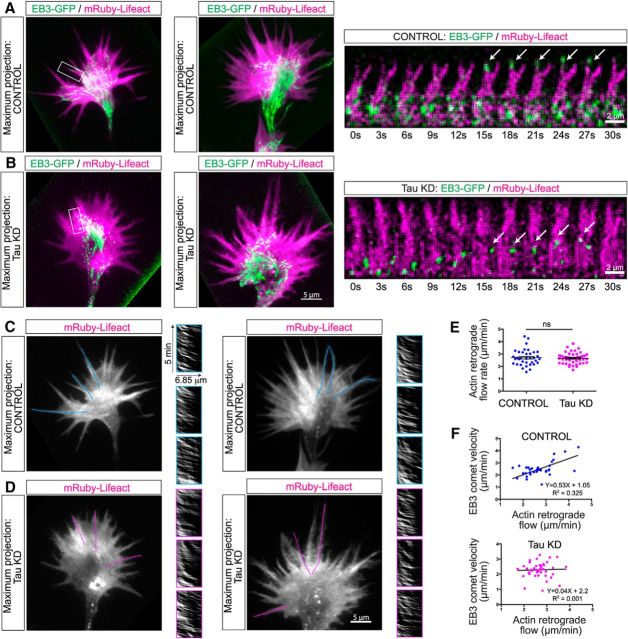
Figure 7.
Tau knockdown disrupts MT organization and dynamic exploration of the growth cone periphery without affecting retrograde flow rate. In growth cones nucleofected with the control vector, the actin marker mRuby-Lifecact (magenta) and EB3-GFP (green; n = 12 growth cones) live-cell imaging over 5 min at 3 s intervals with TIRF (Movie 4) showed that EB3 comets track one another in straight trajectories through all regions of the growth cone and are oriented in the direction of axon outgrowth. The maximum projection images of the movie frames for two controls emphasize the bundled MT arrays in the growth cone center and show EB3 comets extending into the growth cone periphery and invading individual filopodia (A). Image sequences of a single filopodium (boxed region) show an EB3 comet reaching the filopodial tip (arrows). Following tau knockdown (B; n = 12 growth cones), EB3 comets remained in the center of the two growth cones where MTs fail to form bundles. Only a few EB3 comets reached the periphery and in the single filopodium (boxed region) EB3 comets remained in the transition region at the base of the filopodium (arrows). In the tau knockdown growth cones the movements of comets were random; their tracks were disorganized and did not follow one another in the direction of outgrowth (Movie 4). Tau knockdown does not disrupt actin retrograde flow (C, D). Maximum projection images of the same growth cones shown above and in Movie 4 nucleofected with mRuby-Lifeact to label actin filaments were used to create kymographs of retrograde actin flow rates. In filopodia line scans were made from the base to the tip of filopodia (indicated by blue lines in controls and magenta lines after tau knockdown) in which dynamic MTs associate with actin filament bundles. Insets show kymographs of retrograde flow in individual filopodia (n = 45 filopodia from 15 control and 15 tau knockdown growth cones). Scatter plots show that rates of actin retrograde flow (E) are unchanged by tau knockdown. Plots of EB3 comet velocity in relation to retrograde actin flow rates (F) in 45 filopodia show that increased retrograde flow is accompanied by an increase in EB3 comet velocity. In contrast in filopodia after tau knockdown EB3 comet velocity is unrelated to retrograde actin flow rate. Scale bars: growth cones, 5 μm; image series in A and B, 2 μm.

