
Figure 8.
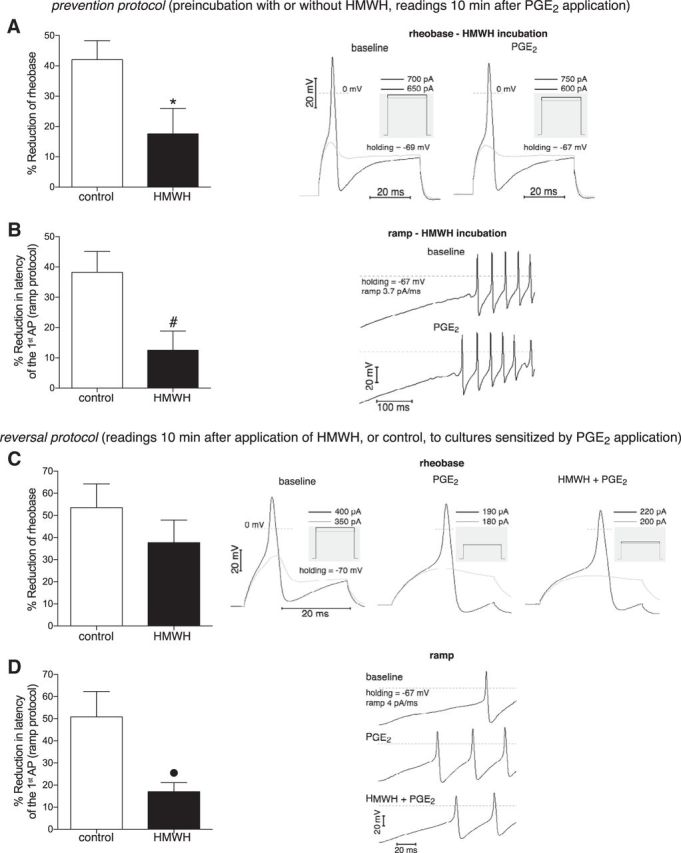
In vitro prevention and reversal of PGE2-induced nociceptor sensitization by HMWH. Neuron sensitization was assessed as relative reduction of rheobase (A, C) and latency of the first AP in ramp protocol (B, D), electrophysiological parameters characterizing electrical excitability of neurons. The effect of HMWH on PGE2-induced neuron sensitization was examined in prevention and reversal protocols. In prevention protocol (A, B), the pronociceptive mediator PGE2 (1 μm) was applied (and remained further in the bathing solution) after 30 min preincubation in the presence (black bars) or absence (white bars) of HMWH (0.2 mg/ml). In the HMWH groups, to avoid effects of washout, the HMWH concentration was kept constant in all solutions during recording, including during PGE2 application. Readings were obtained 10 min after the application of PGE2 had started, when a stable effect was achieved. As observed in the bar graphs (left side of each panel, showing the relative changes of parameters), PGE2 induced significantly smaller reduction of both rheobase (A) and latency (B) after preincubation with HMWH compared with the control groups (white bars), indicating the inhibitory effect of preincubation with HMWH on neuron sensitization induced by PGE2 (A, t(13) = 2.3, *p = 0.036; B, t(15) = 2.8, #p = 0.015; when control and HMWH groups are compared; unpaired Student's t test with Welch's correction). In reversal protocol (C, D), PGE2 was applied first (and remained further during bathing and applications). When a stable effect was achieved, the same PGE2-containing solution without (white bars) or with (black bars) HMWH was administered and remained in the experimental chamber. Reading of the parameters 10 min later revealed a tendency to attenuation of rheobase reduction (C, t(10) = 1.1, p = 0.31, not significant) and significantly smaller reduction of AP latency (D, t(7) = 2.8, ●p = 0.027, unpaired Student's t test with Welch's correction) when HMWH was administered (black bars), compared with the control (white bars), suggesting at least partial reversal of PGE2-induced neuron sensitization by HMWH. Right side of each panel: Respective original trRight side of each panelaces of membrane potential, recorded in current-clamp mode of whole-cell patch clamp, illustrating the onset of APs. Vertical calibration for all traces: 20 mV. Horizontal calibration: 20 ms for all traces, except for B (100 ms). A, C, Black traces represent AP generation in response to rheobase current injection. Gray traces represent responses to stimulation below rheobase (no AP generation). The magnitude of the current pulses is shown above the boxes illustrating the stimulation profile (gray insets). B, D, Generation of APs in response to ramp current injection. The traces corresponding to the different treatments (PGE2 or PGE2 + HMWH) are stacked vertically to emphasize changes in latency of the first AP. A, B, Right: Traces recorded in the same neuron after preincubation with HMWH, before and after PGE2 application (note the larger changes induced by PGE2 without HMWH shown in middle traces from C, D). C, Left, Middle, and Right sets of traces, D, Top, Middle, and Bottom traces: Recordings before interventions, after PGE2 and HMWH applications, correspondingly. A, Control group, n = 17 neurons; HMWH group, n = 7 neurons. B, Control group, n = 15 neurons; HMWH group, n = 6 neurons. C, Control group, n = 6 neurons; HMWH group, n = 7 neurons. D, Control group, n = 7 neurons; HMWH group, n = 6 neurons.