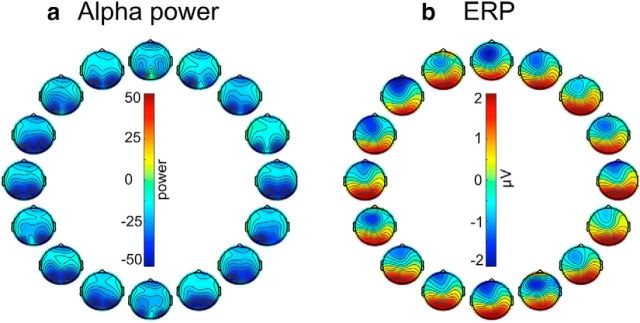
Figure 2.
Topography of (a) instantaneous alpha power and (b) ERP activity for each of 16 sample orientations, averaged across the delay interval and participants in Experiment 1. Both alpha power and ERP amplitude were computed relative to the prestimulus baseline period. The position of each scalp map corresponds to the orientation of the sample teardrop.

