
Figure 3.
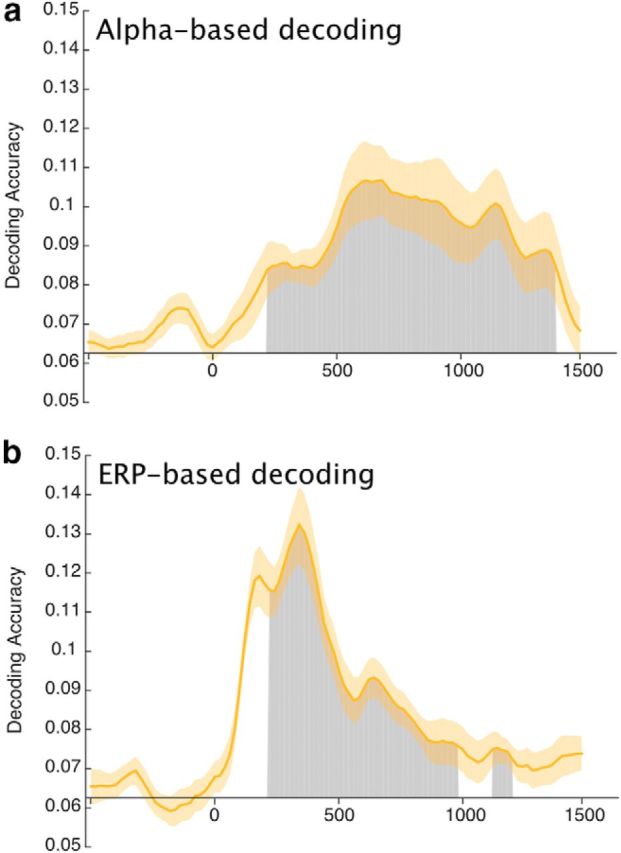
Mean accuracy of (a) alpha-based decoding and (b) ERP-based decoding in Experiment 1. Chance-level performance (0.0625 = 1/16) is indicated by the black horizontal lines. Gray areas indicate clusters of time points in which the decoding was significantly greater than chance after correction for multiple comparisons. Note that the first 200 ms following stimulus onset were excluded from the statistical analysis to minimize any contributions of sensory activity to the decoding. The orange shading indicates ±1 SEM.