
Figure 6.
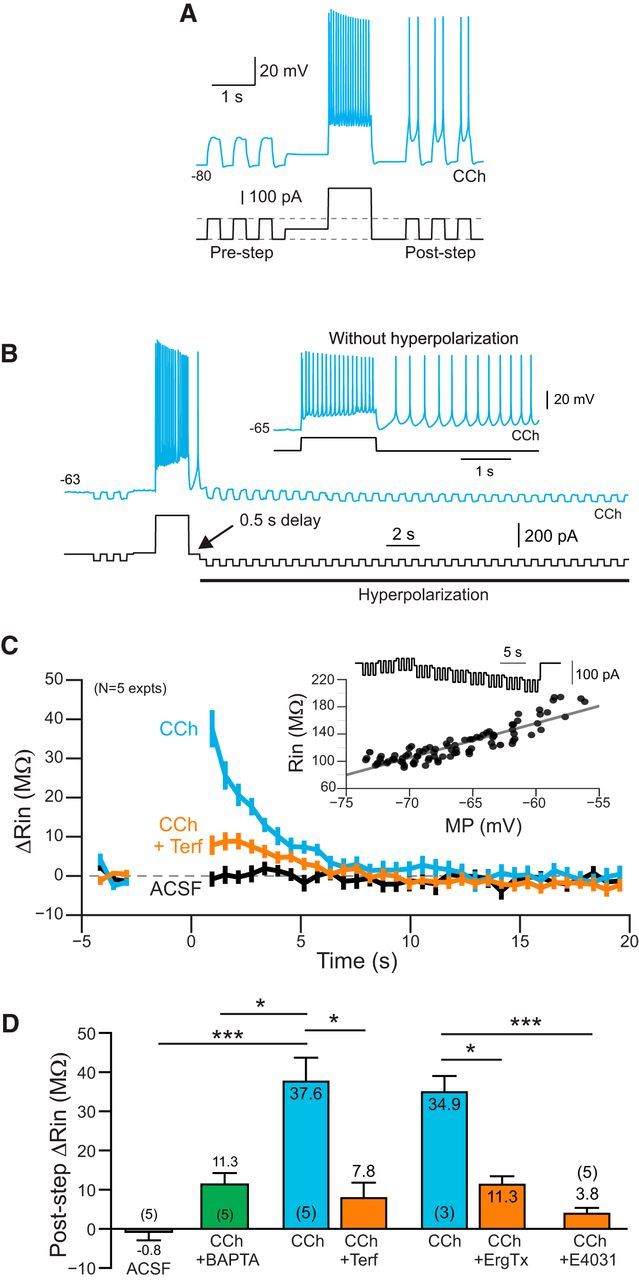
Time course of ERG-mediated change in input resistance. A, Demonstration of increased excitability following a depolarizing conditioning step in CCh. Brief test pulses that were subthreshold before the conditioning step become suprathreshold following the step. Neuron maintained at −80 mV to prevent persistent firing between test pulses. B, Example response to a train of hyperpolarizing test pulses used to assay input resistance. Additional continuous hyperpolarizing bias current was applied 500 ms following the offset of the depolarizing conditioning step. Without this bias current, the neuron fired persistently in response to the conditioning step (inset). C, Plot of the change in input resistance assayed by hyperpolarizing pulses in ACSF (black plot), CCh (blue), and CCh + Terf (orange). See Materials and Methods for details. Inset shows example input resistance calibration response. D, Summary of change input resistance following the depolarizing conditioning step. ***ACSF/CCh: p = 1.29E-04, T = 6.23, df = 11, two-sample t test; *CCh/BAPTA vs CCh: p = 0.0171, T = 3.46, df = 8, two sample t test; *CCh/CCh+Terf: p = 0.022, T = 4.49, df = 4, paired t test; *CCh/CCh+ErgTx: p = 0.029, T = 5.79, df = 2, paired t test; ***CCh vs CCh/E4031: p = 3.29E-04, T = 5.58, df = 11, two-sample t test. Two independent CCh datasets (N = 3 and 5) were combined when computing two-sample t test statistics.