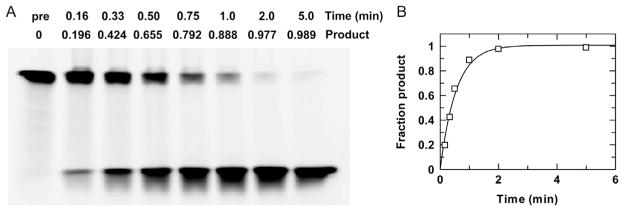
Fig. 6.
Electrophoretic (gel-based) analysis of glycosylase activity. (A) Gel-based analysis of a single-turnover reaction, collected with 0.25 μM TDG and 0.025 μM G·U substrate (3′-6-FAM labeled) at 22°C. Samples quenched at indicated time points were analyzed to determine the fraction product, based on the intensity of imaged bands corresponding to substrate (upper) and product (lower). (B) Fitting the resulting progress curve to Eq. (1) yields a rate constant of kobs = 1.9 ±0.2 min−1.

